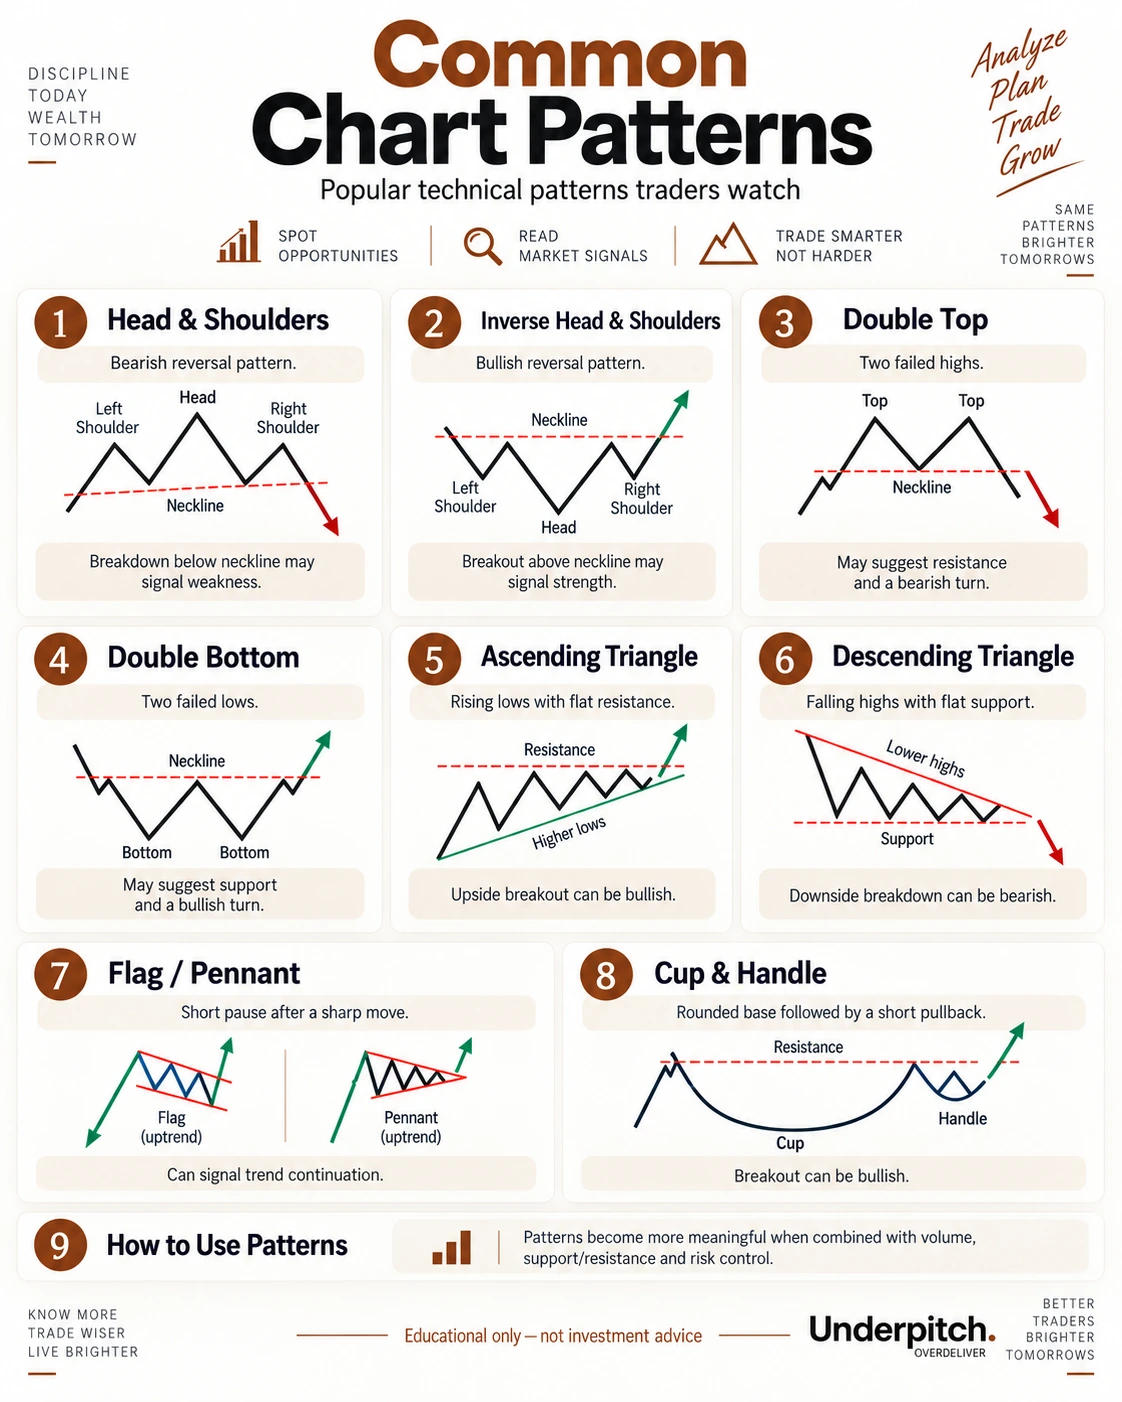
Common chart patterns
Detailed explanations of ten widely followed chart patterns, what they mean, how traders confirm them and why risk control matters.
How to use chart patterns correctly
Patterns are descriptions of price structure, not guaranteed forecasts. Define the pattern, identify the confirmation level, check volume/context, and know where the setup is invalidated before acting.
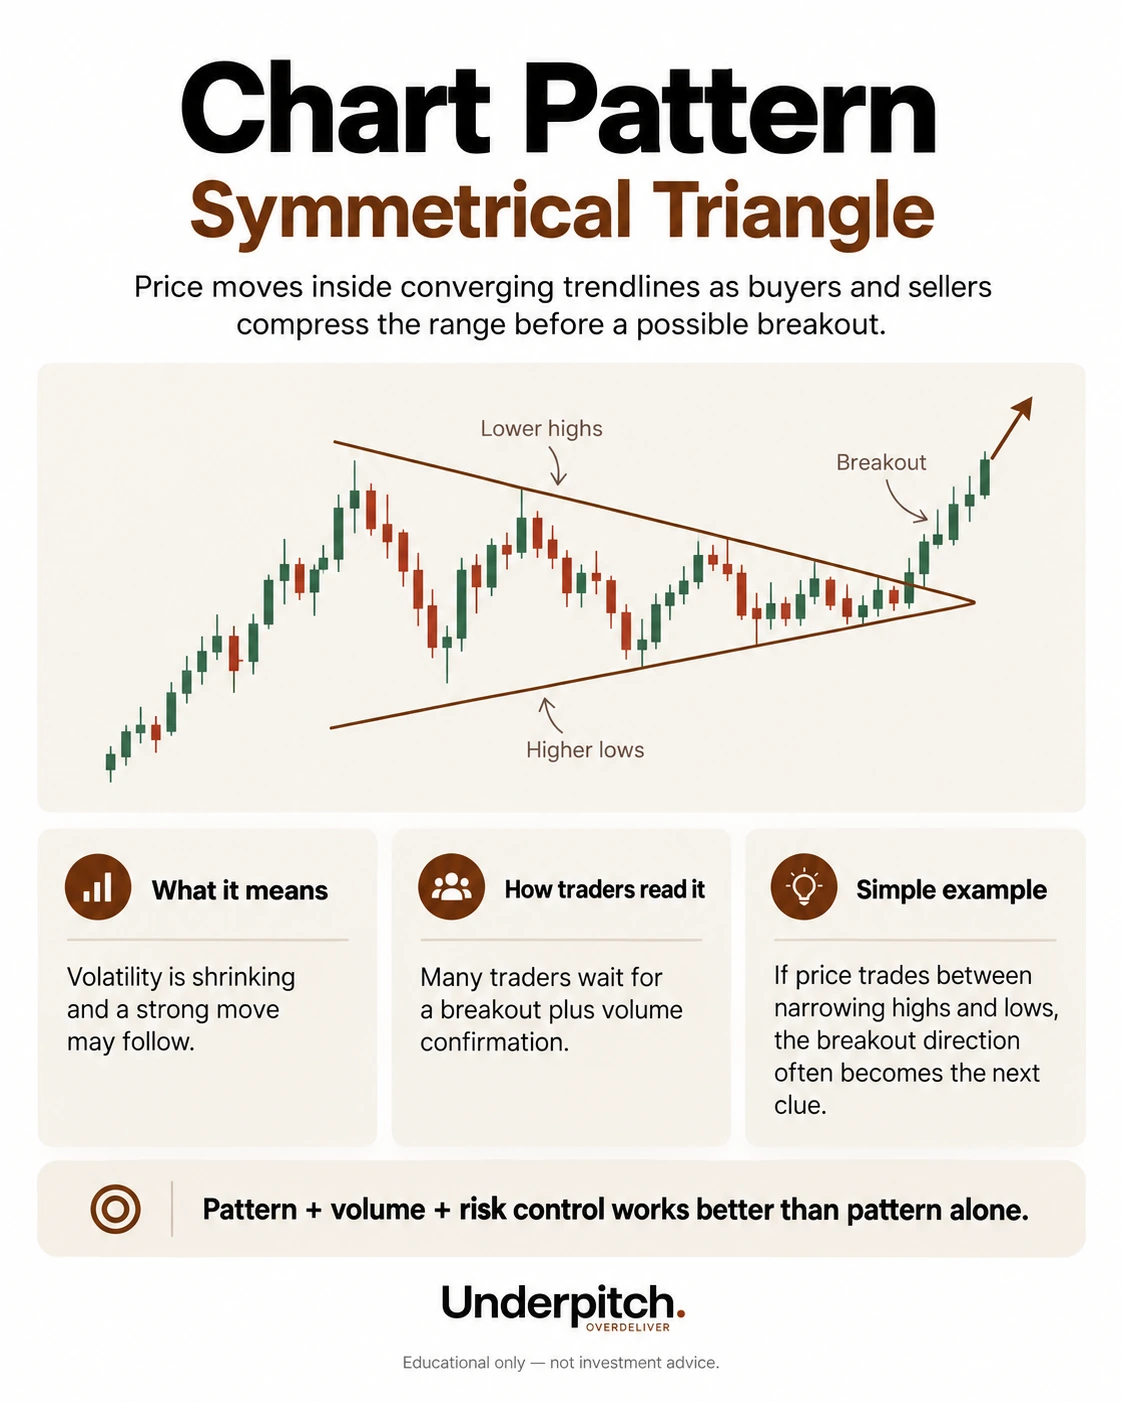
Symmetrical triangle
Highs fall while lows rise, compressing price. Direction is not confirmed until the market breaks out.
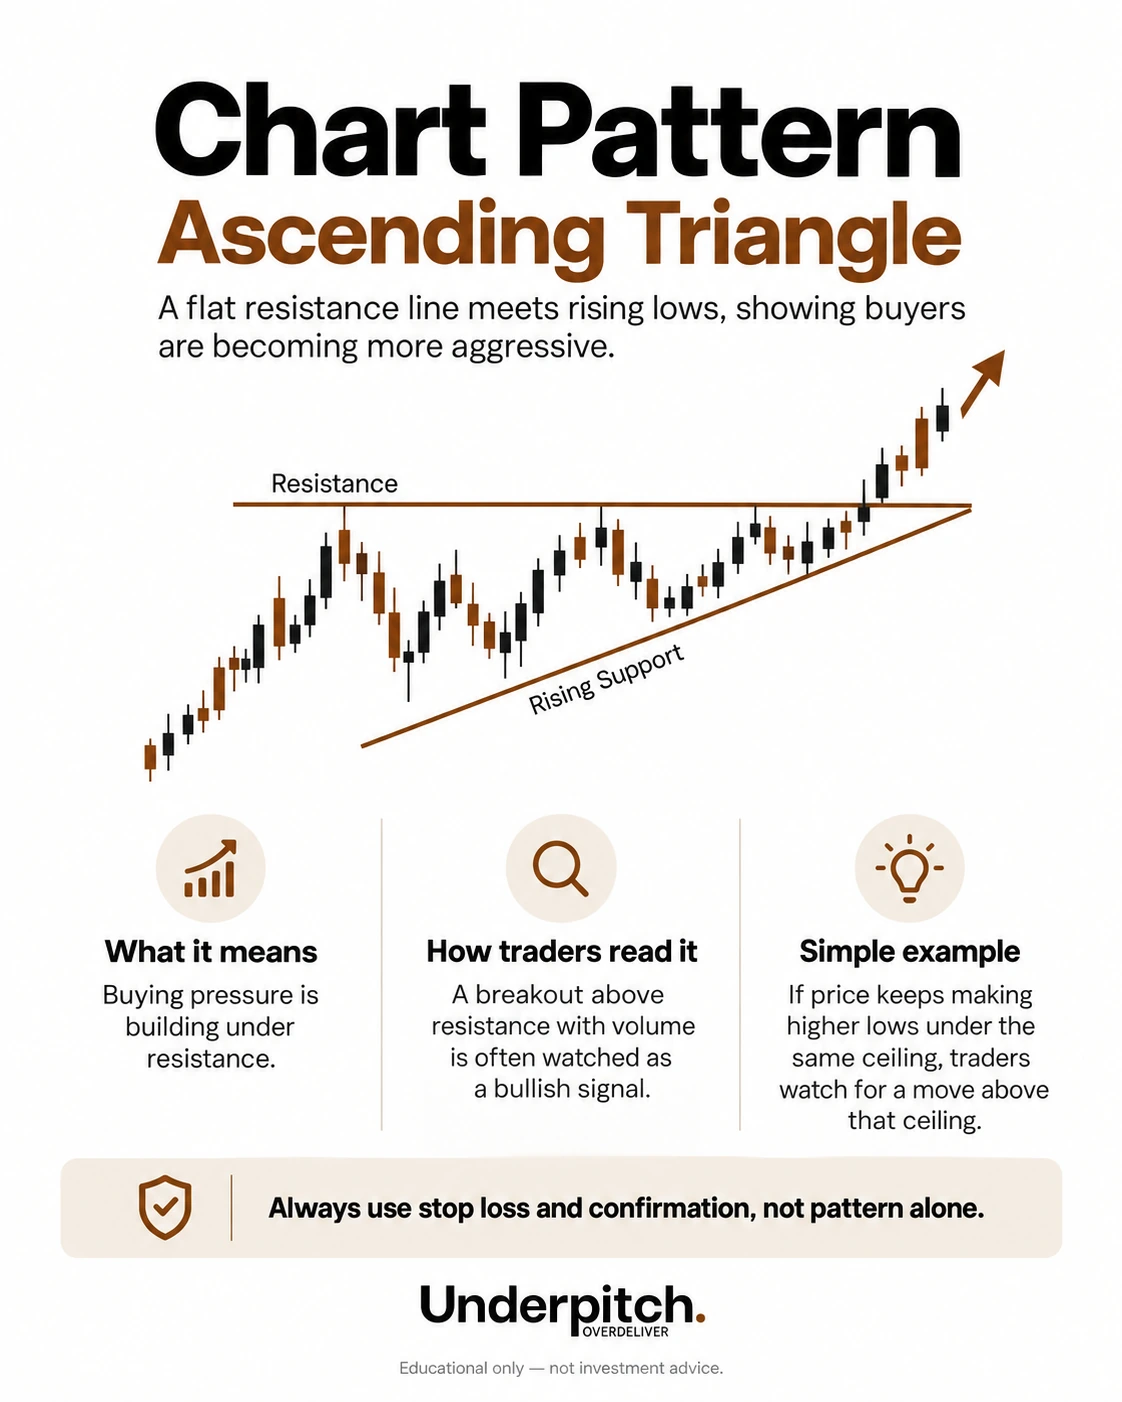
Ascending triangle
Horizontal resistance plus rising lows often reflects increasing buying pressure; confirmation requires a breakout.
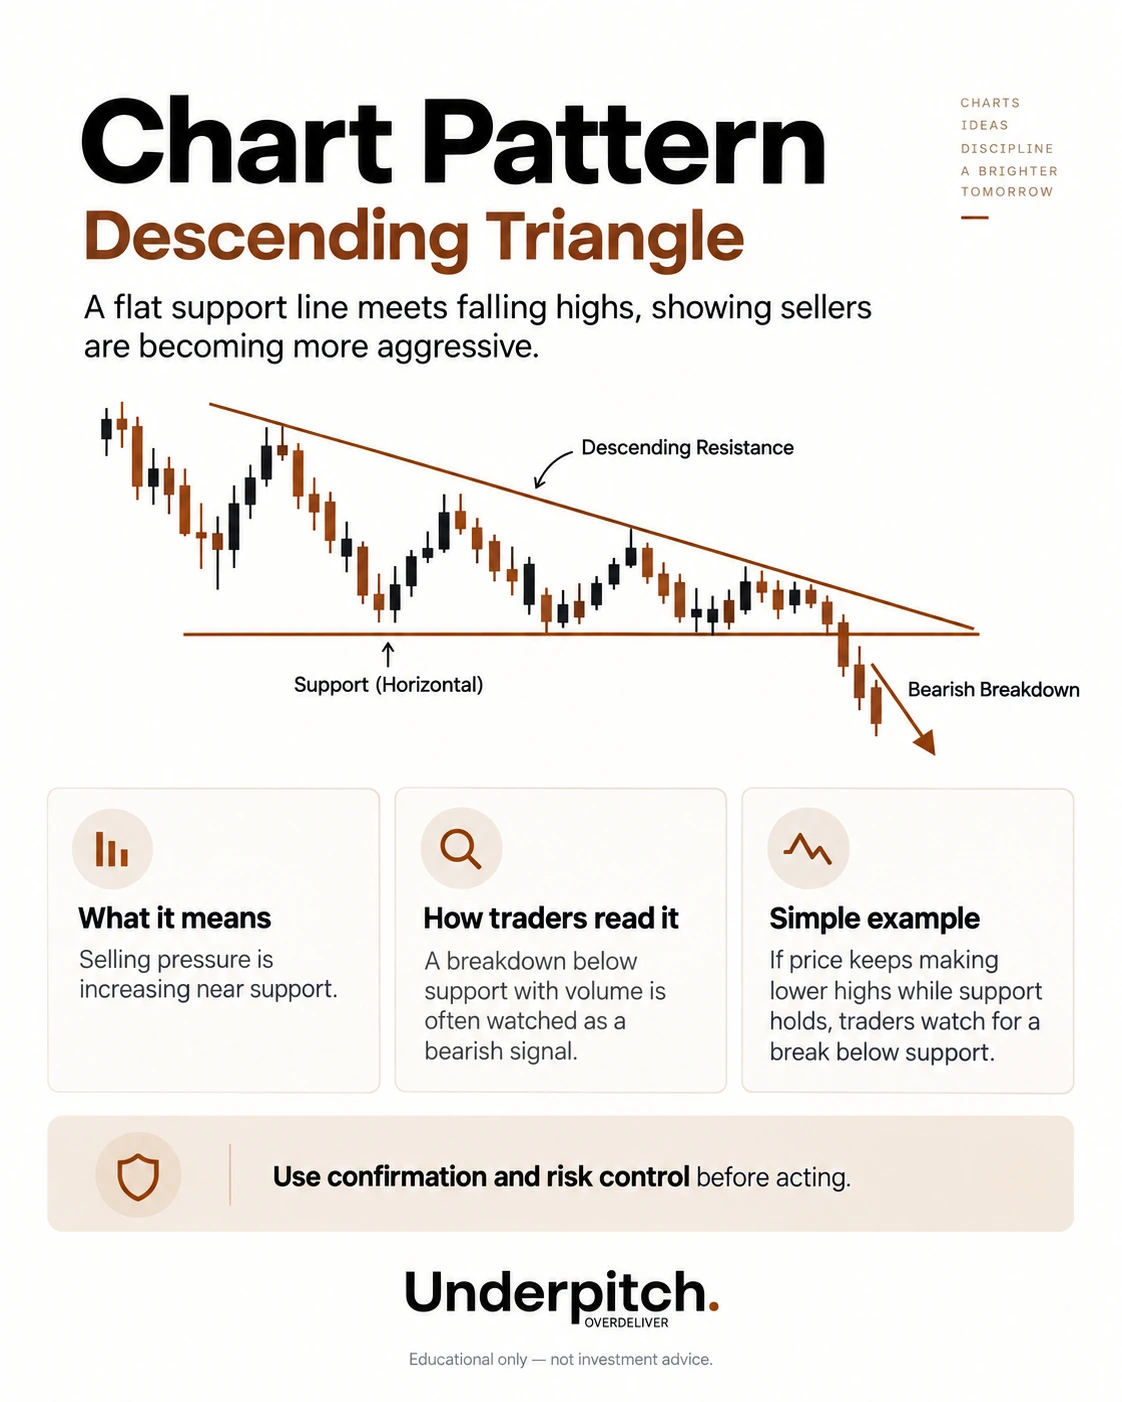
Descending triangle
Horizontal support plus falling highs can reflect increasing selling pressure; confirmation requires a breakdown.
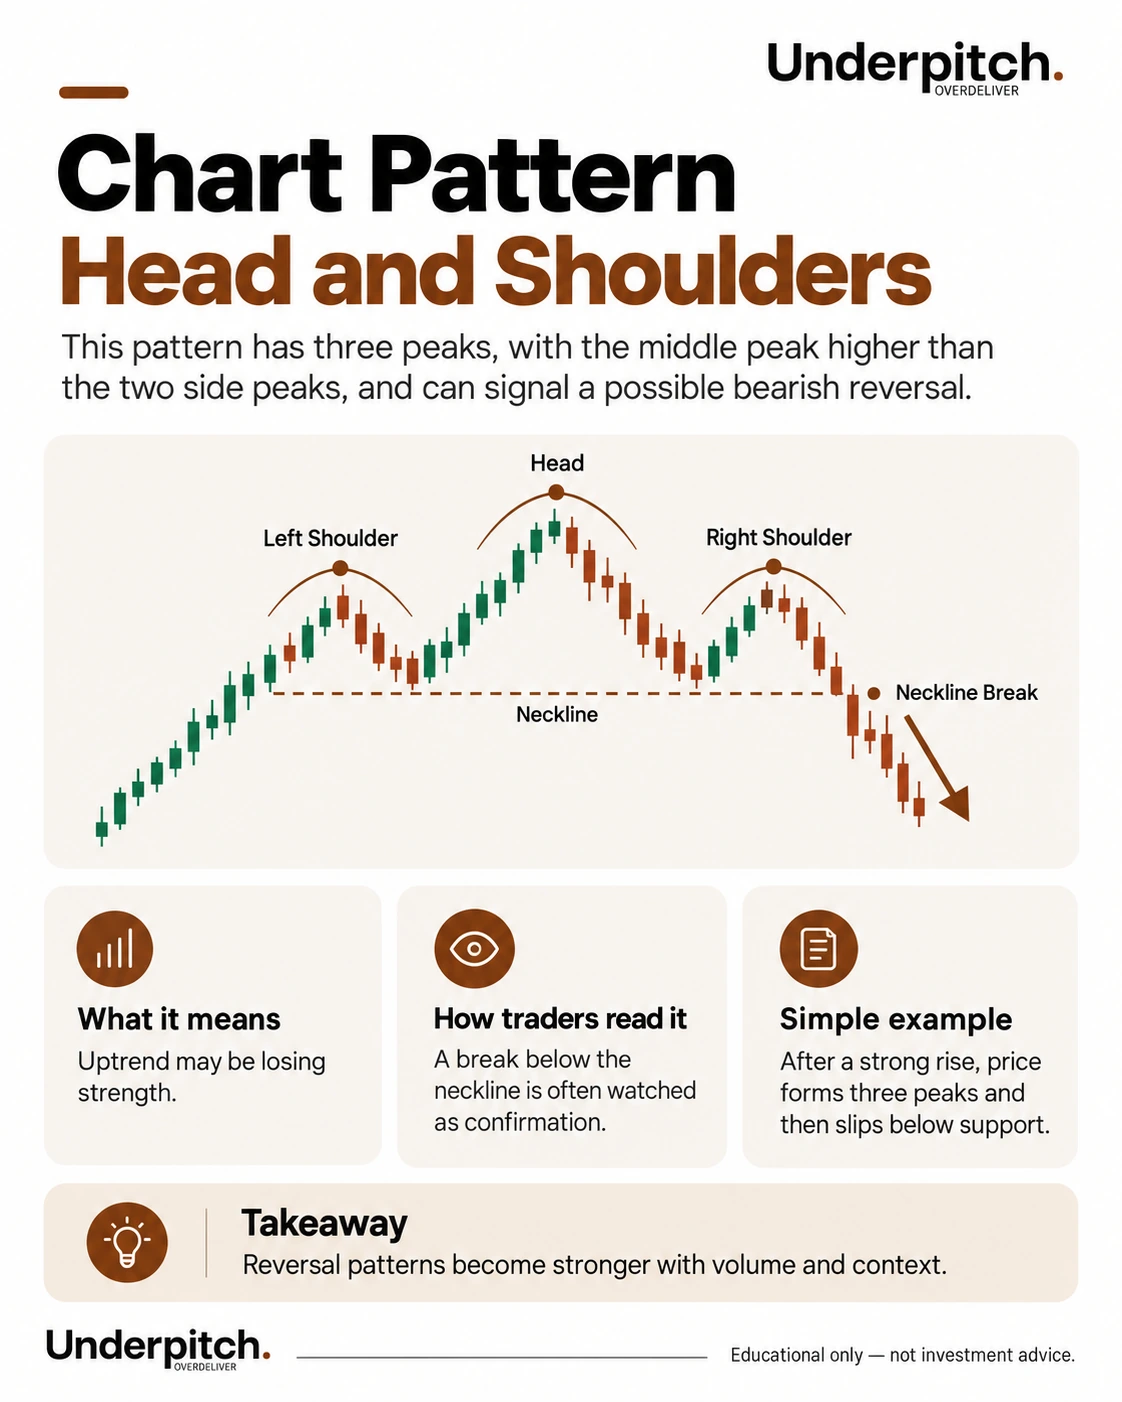
Head and shoulders
Three peaks with a higher middle peak. A neckline break can confirm a bearish reversal setup.
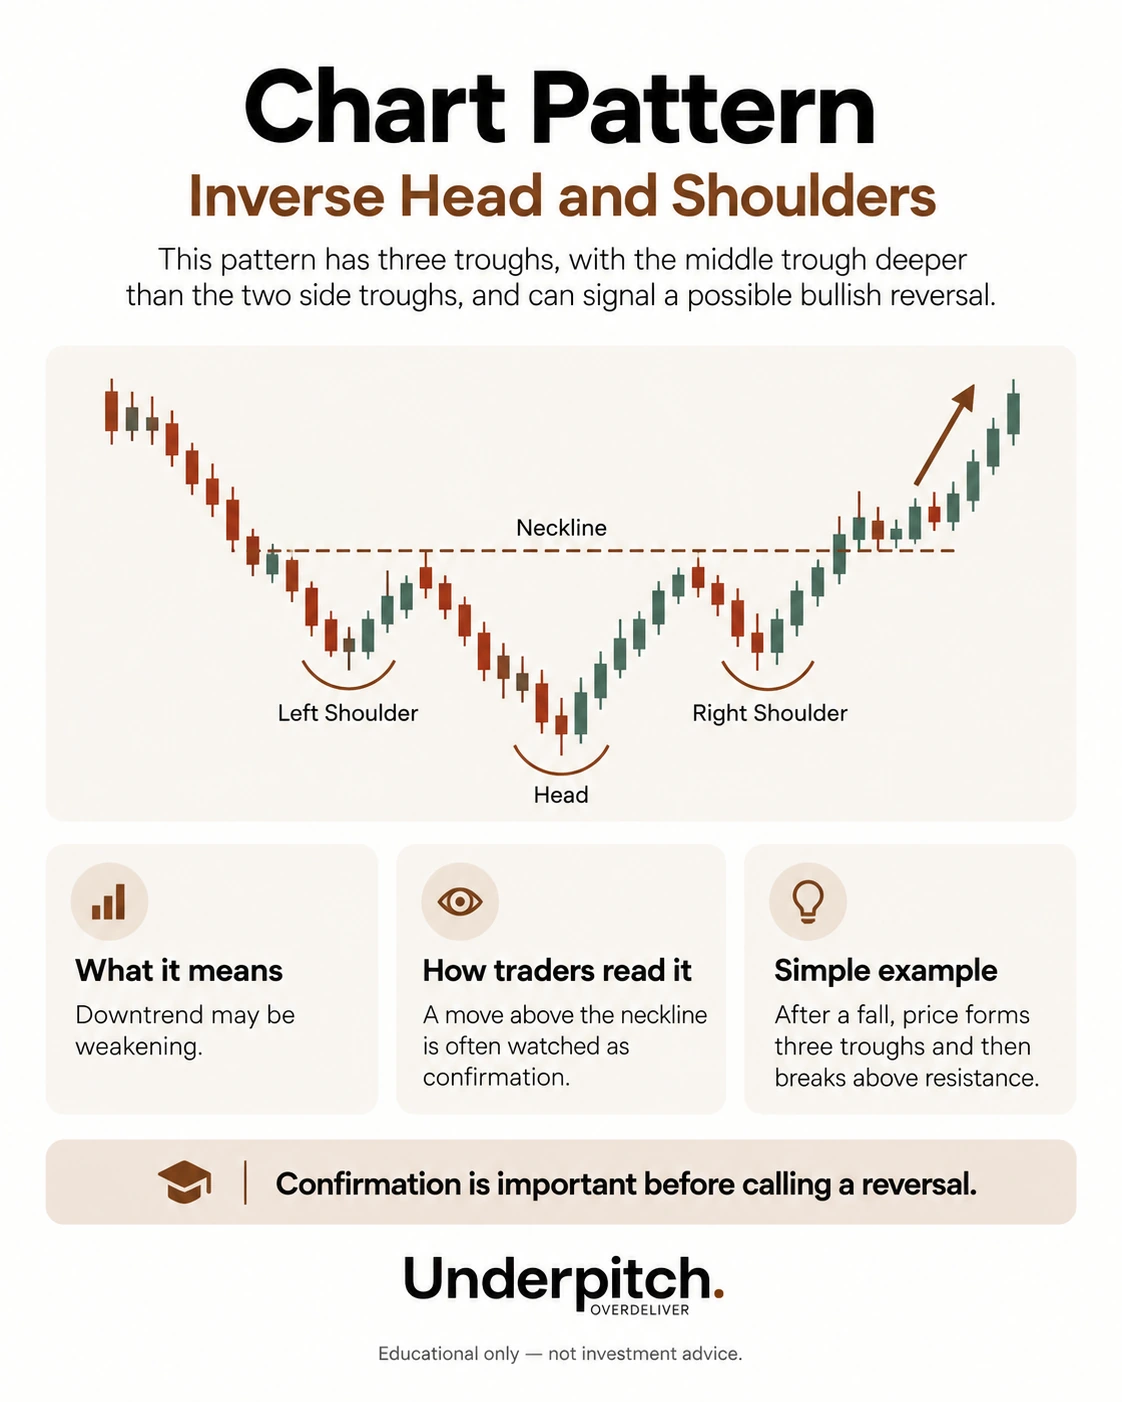
Inverse head and shoulders
Three troughs with a deeper middle trough. A neckline break can confirm a bullish reversal setup.
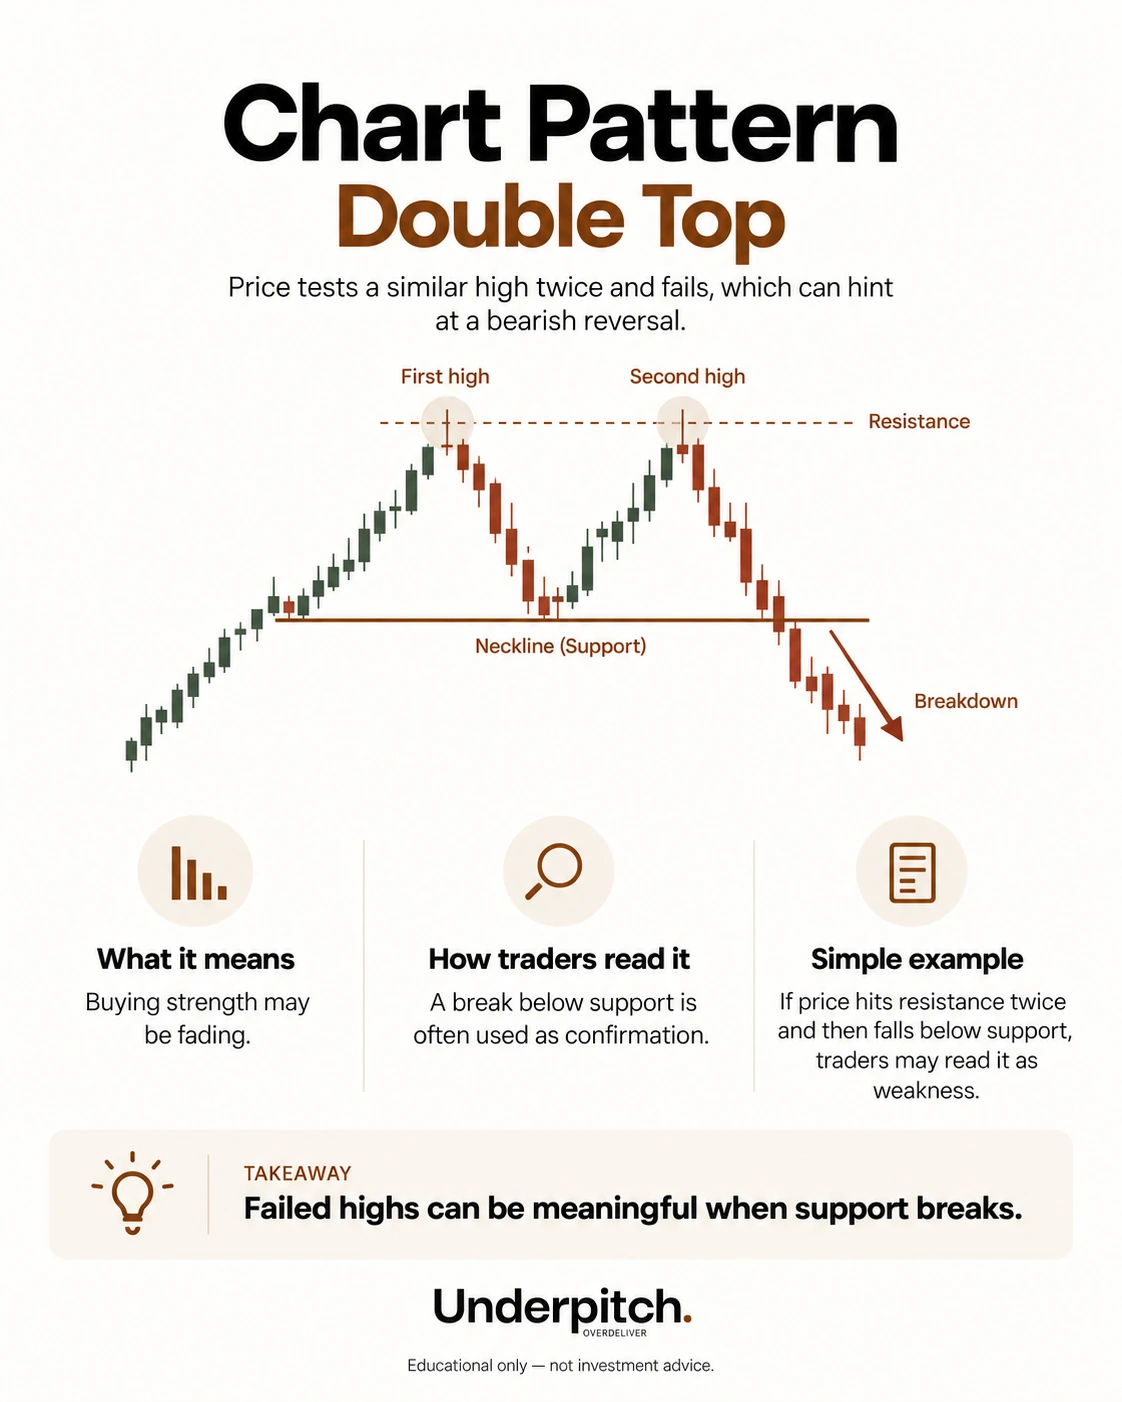
Double top
Price fails twice near a similar high; a break below the intervening support strengthens the bearish interpretation.
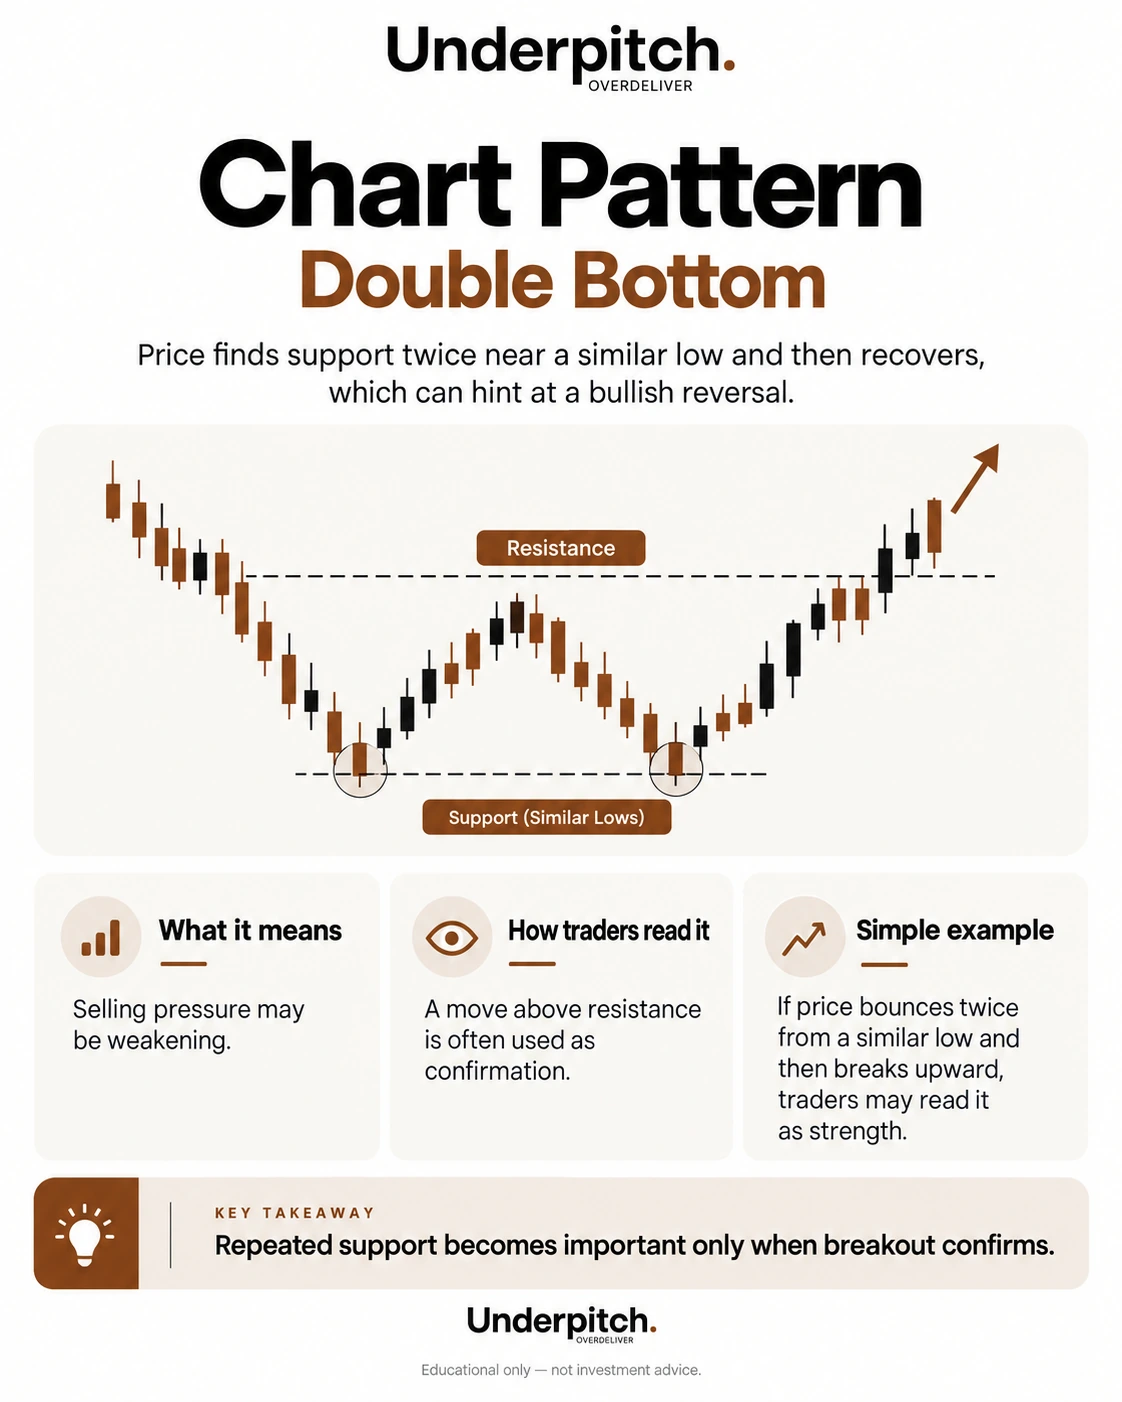
Double bottom
Price holds twice near a similar low; a break above intervening resistance strengthens the bullish interpretation.
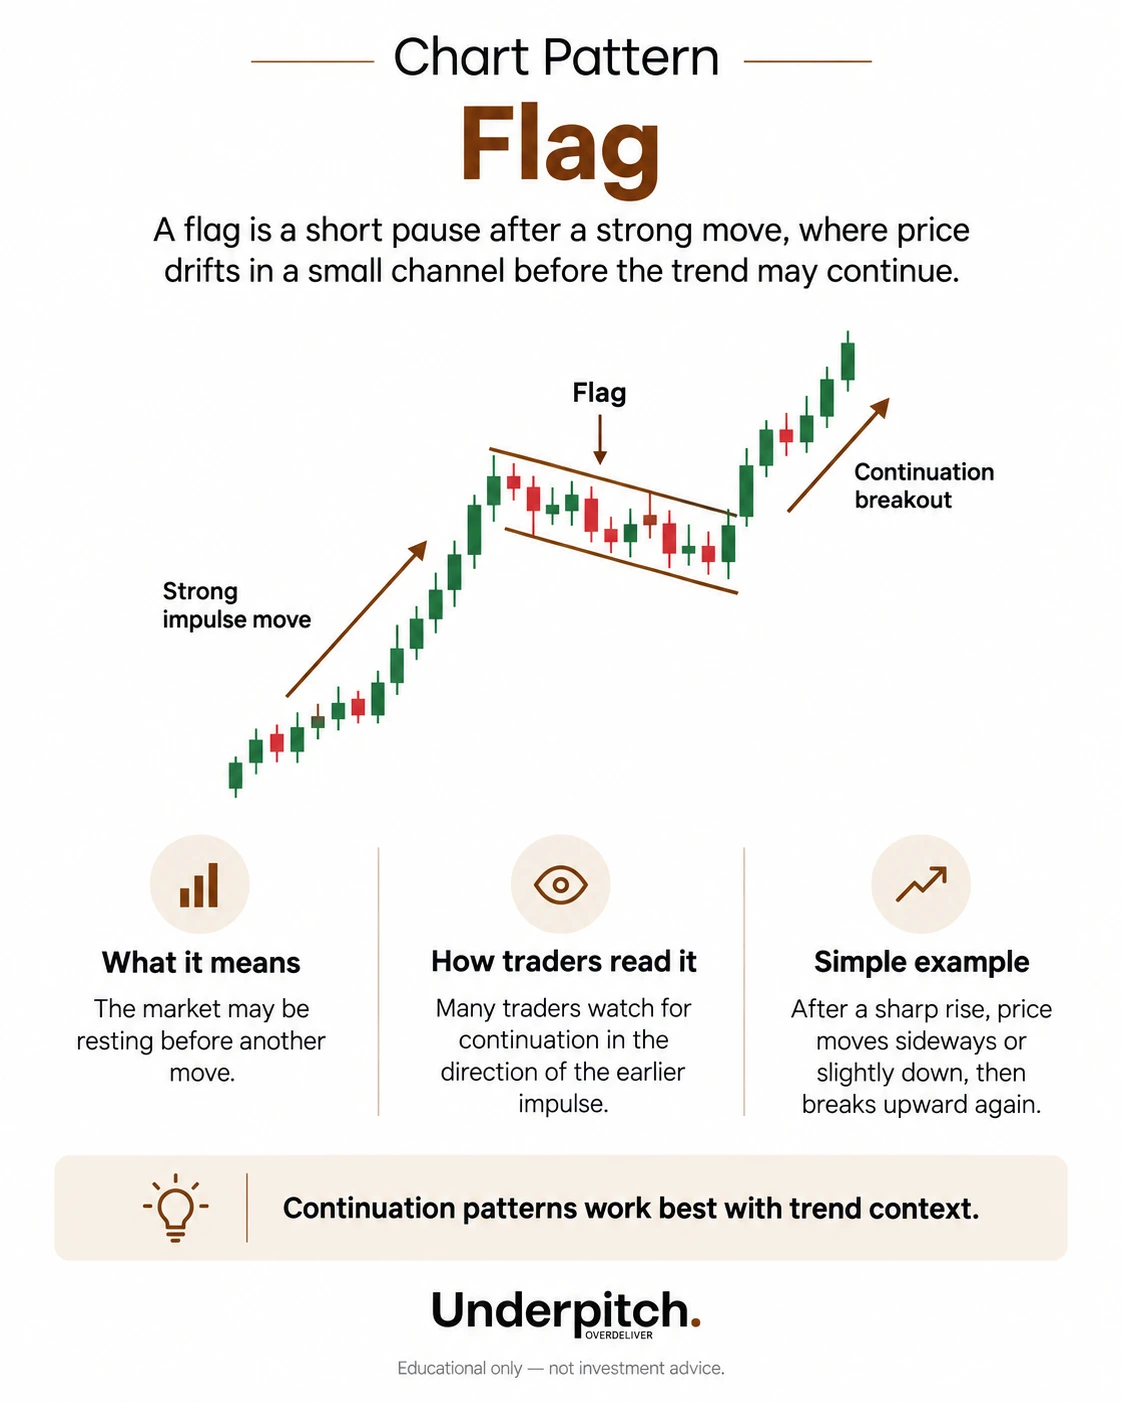
Flag
A short, usually counter-trend channel after a strong impulse. Traders watch for continuation in the direction of the prior move.
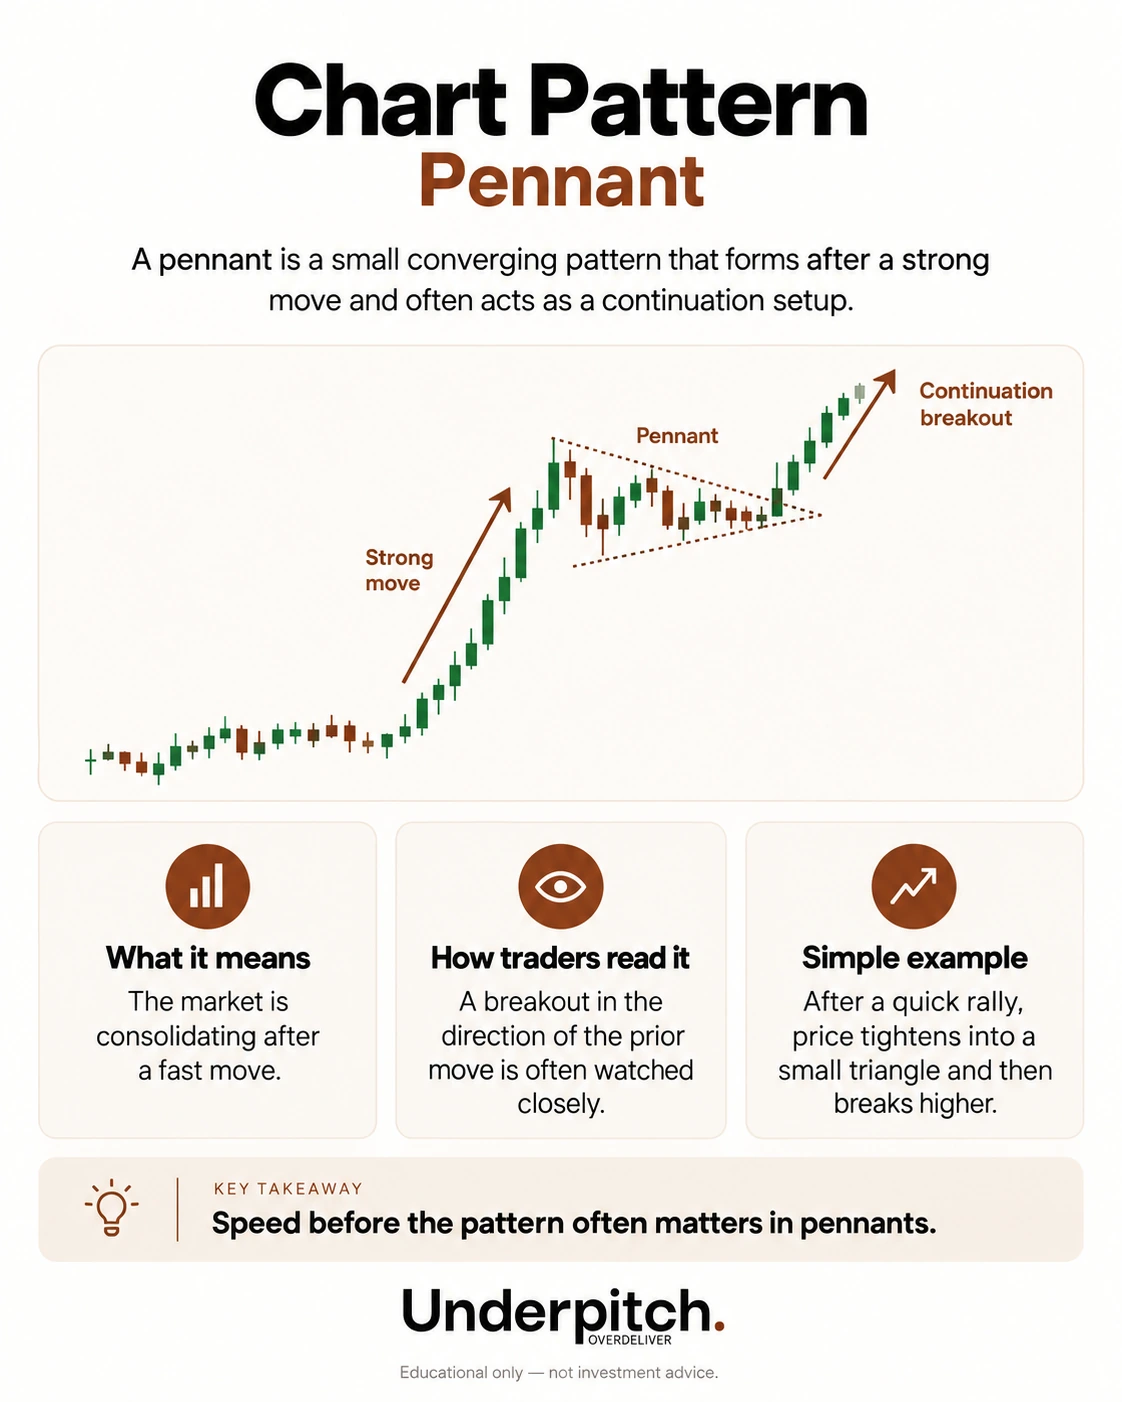
Pennant
A small converging consolidation after a sharp move. Similar to a miniature triangle following an impulse.
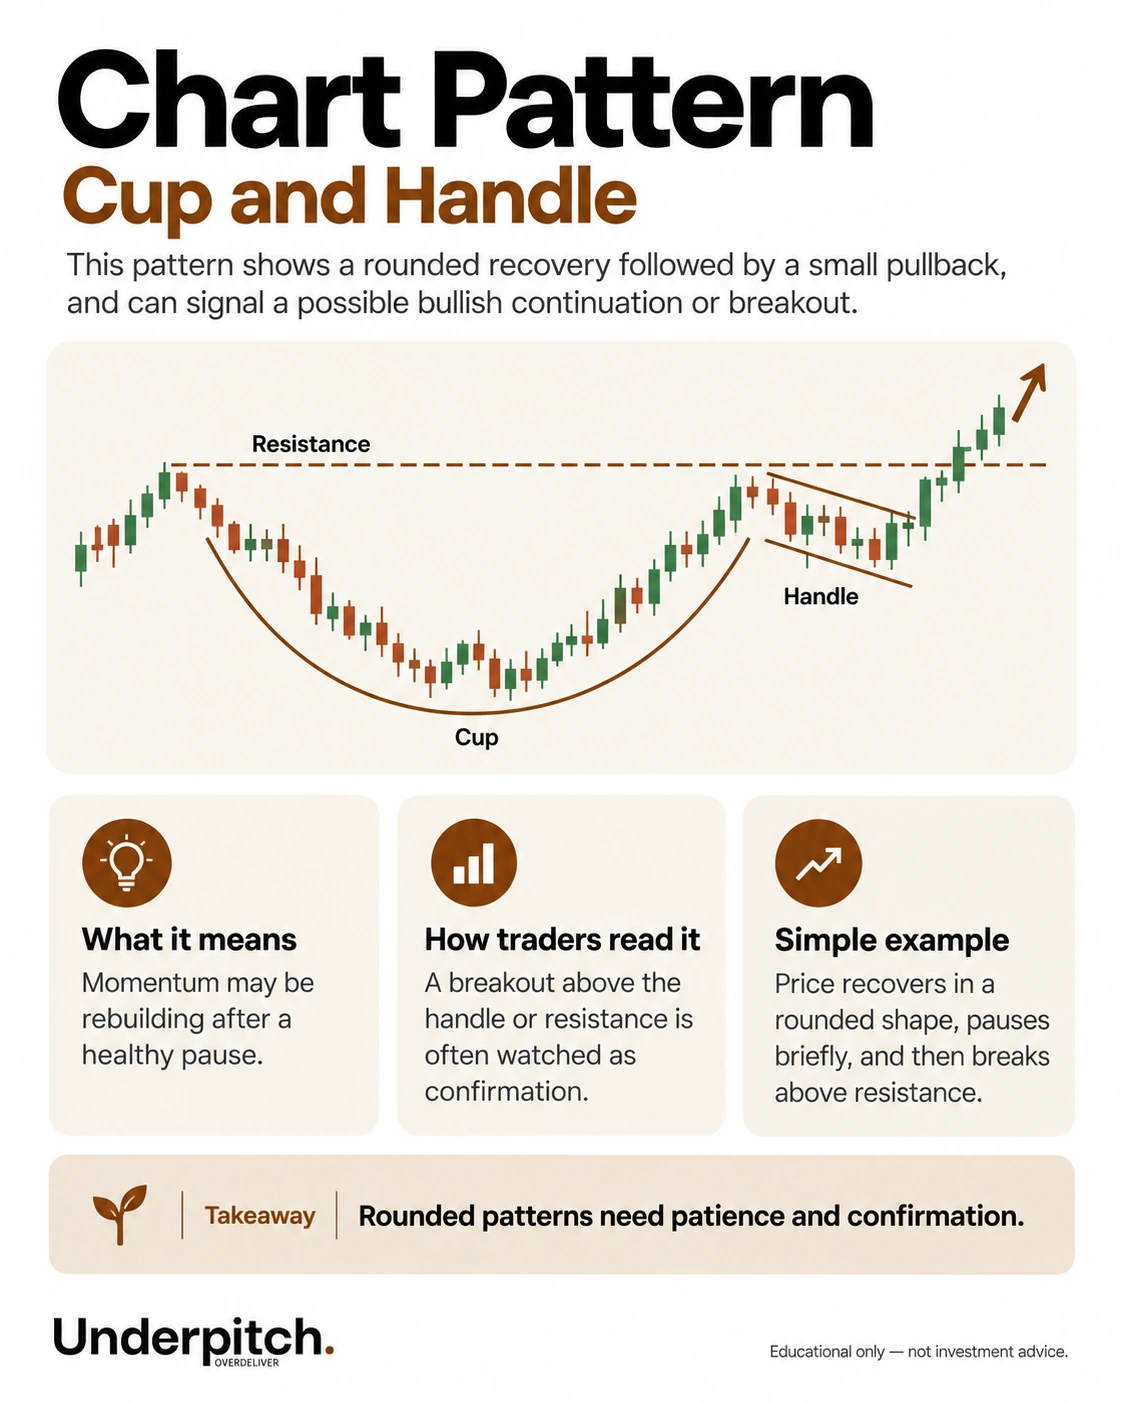
Cup and handle
A rounded recovery followed by a smaller pullback; the breakout area is usually the prior resistance/handle zone.