
Technical analysis
Price action, candlesticks, trend, support and resistance, volume, momentum and risk management — explained as probabilistic tools, not predictions.
What is technical analysis?
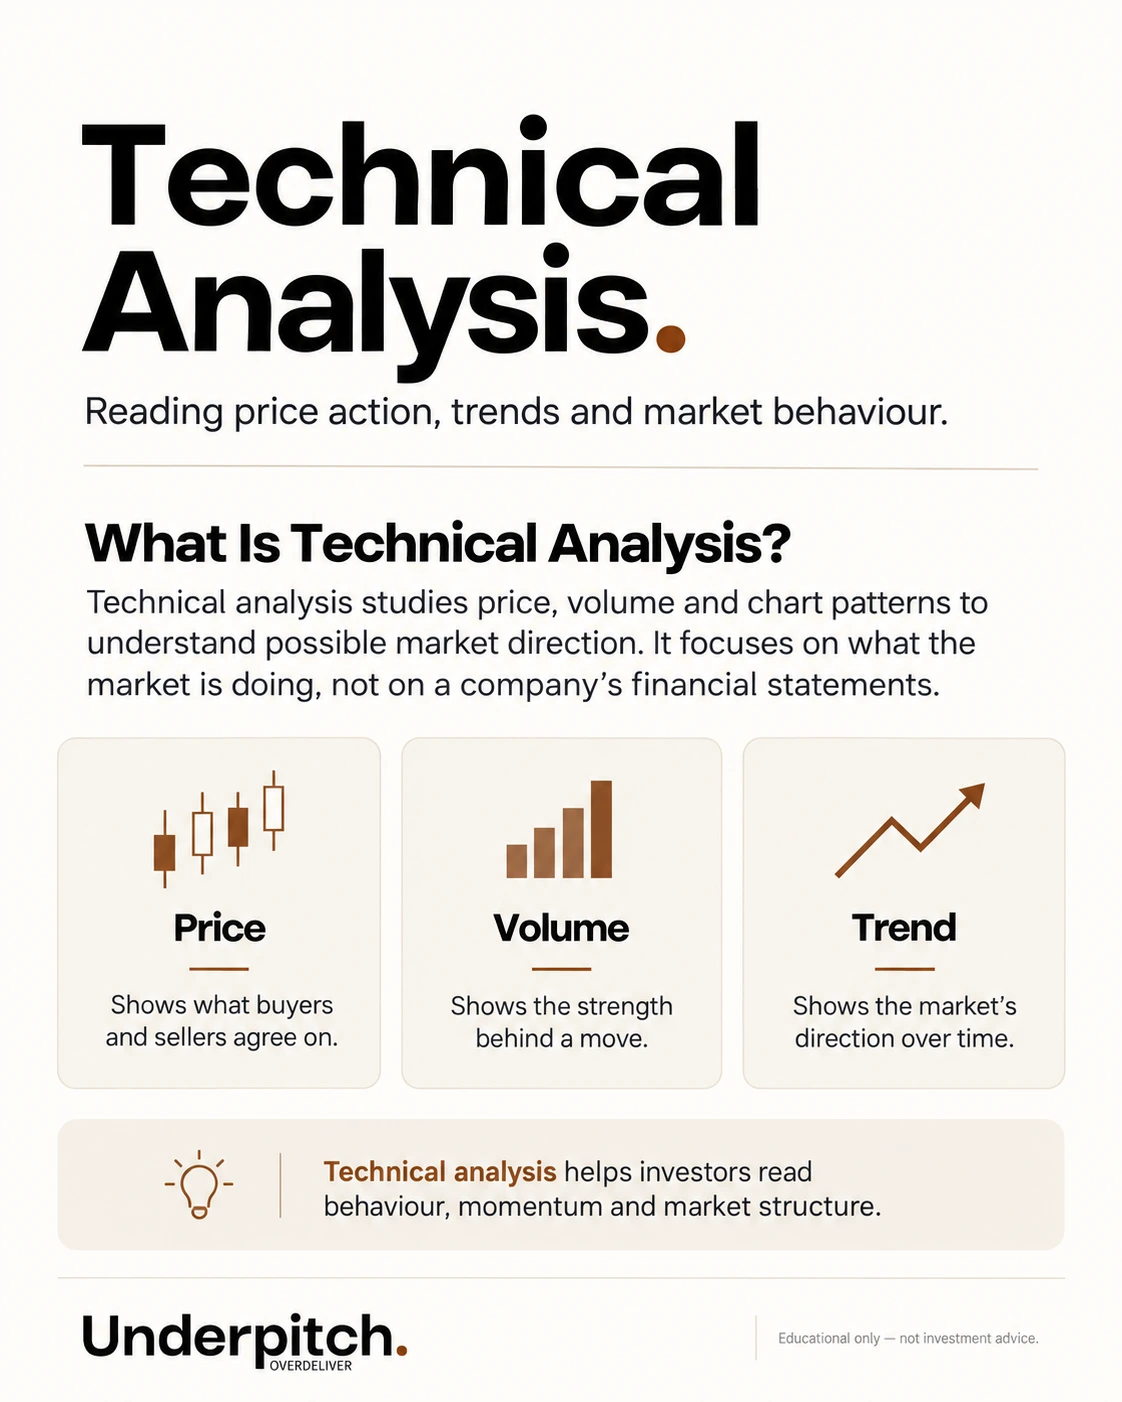
Technical analysis studies price, volume and market structure to understand trend, momentum, volatility and potential areas of supply/demand. It does not know the future; it organizes market behaviour into repeatable observations and probabilities.
Price charts and candlesticks
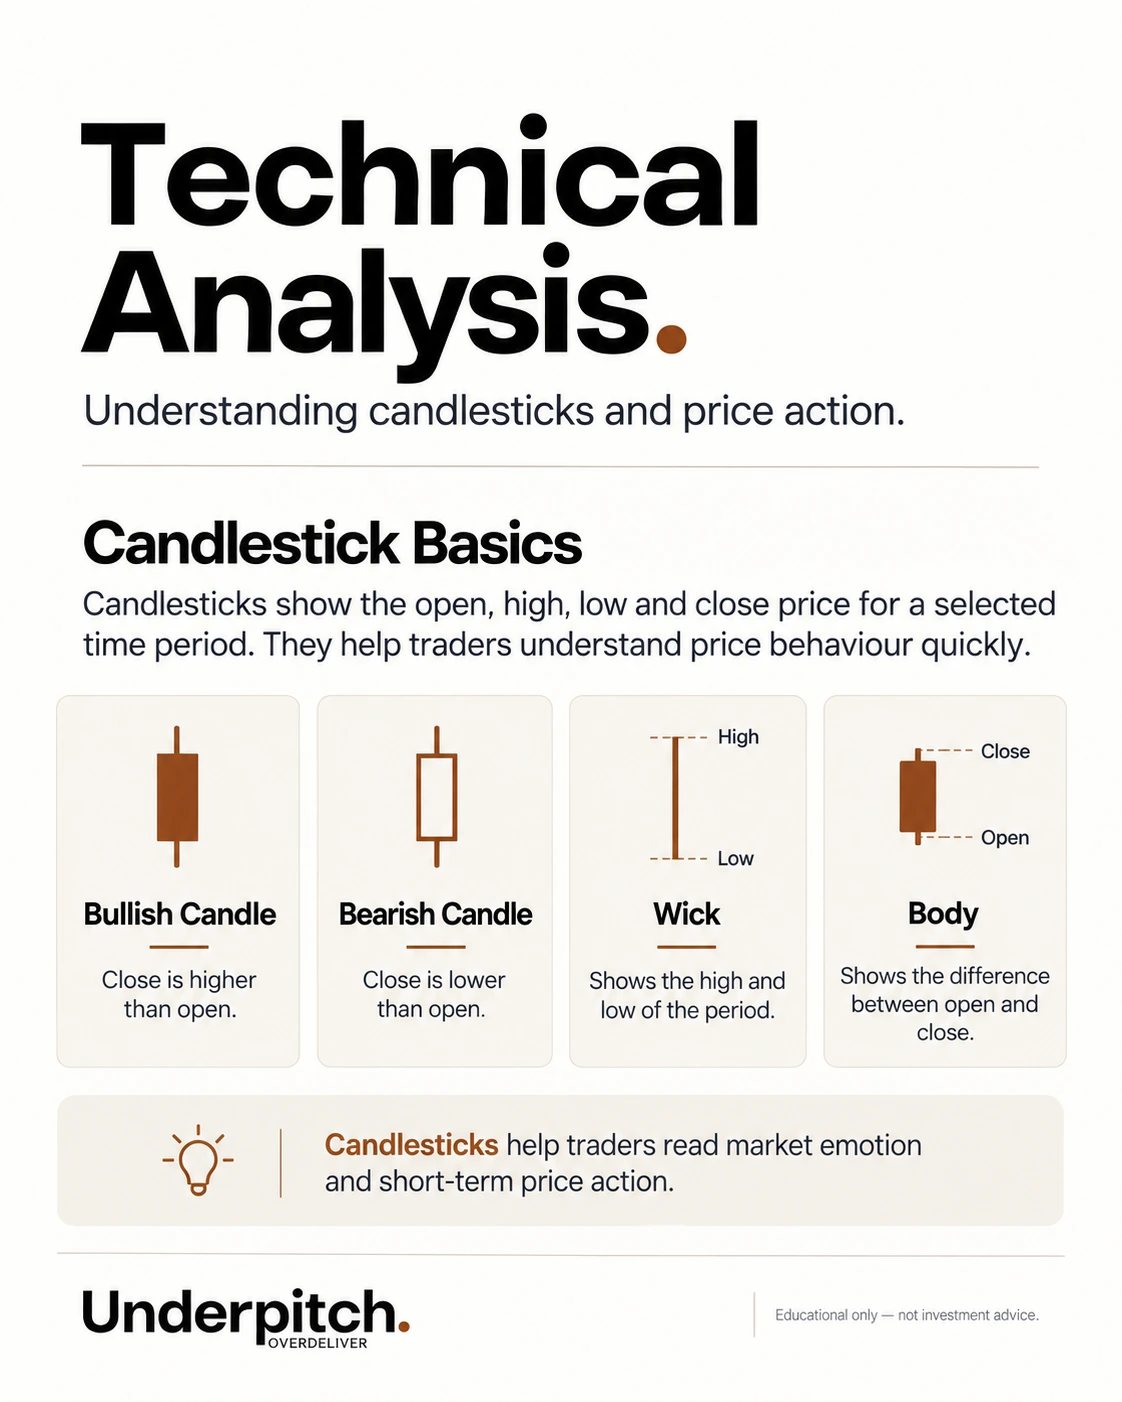
A candlestick shows open, high, low and close for a chosen time period. The body shows the open-to-close range; wicks show the extremes. Candles are most useful in context — trend, level, volume and volatility — rather than as isolated “signals.”
Trend
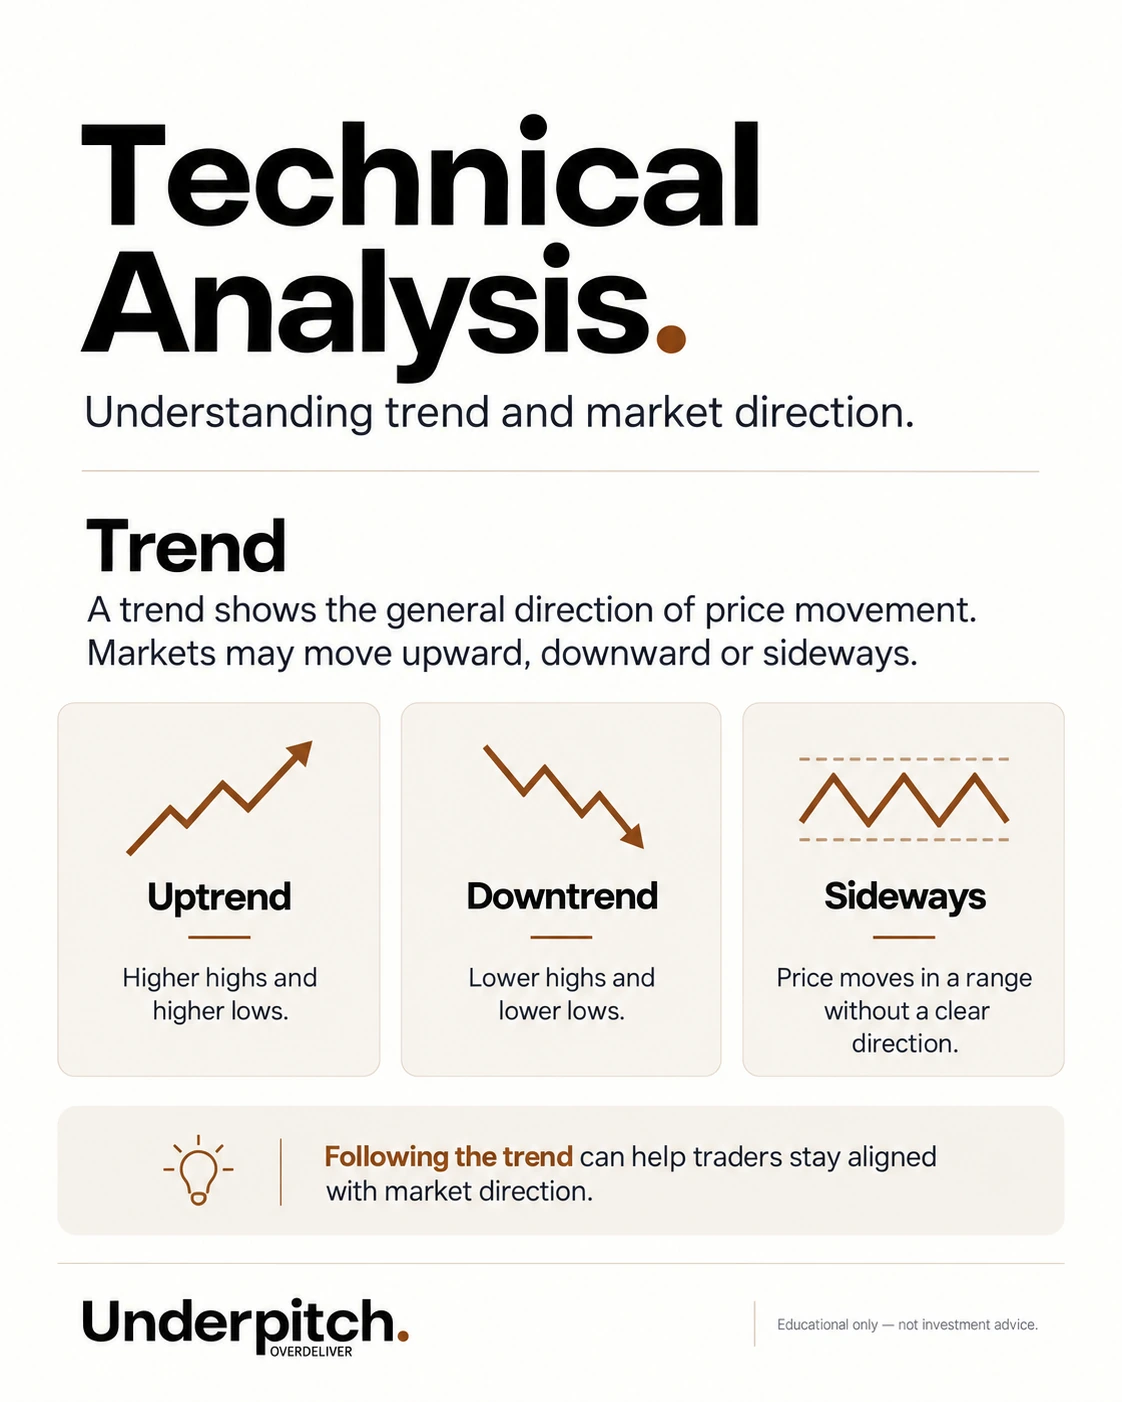
An uptrend generally forms higher highs and higher lows. A downtrend forms lower highs and lower lows. A sideways market oscillates in a range. Timeframe matters: a stock can be in a daily downtrend inside a multi-year uptrend.
Support and resistance
Support is a zone where demand has previously been strong enough to slow a decline. Resistance is a zone where supply has slowed a rise. Treat them as zones, not exact lines. A breakout becomes more credible when price closes beyond the area and participation/volume supports it.
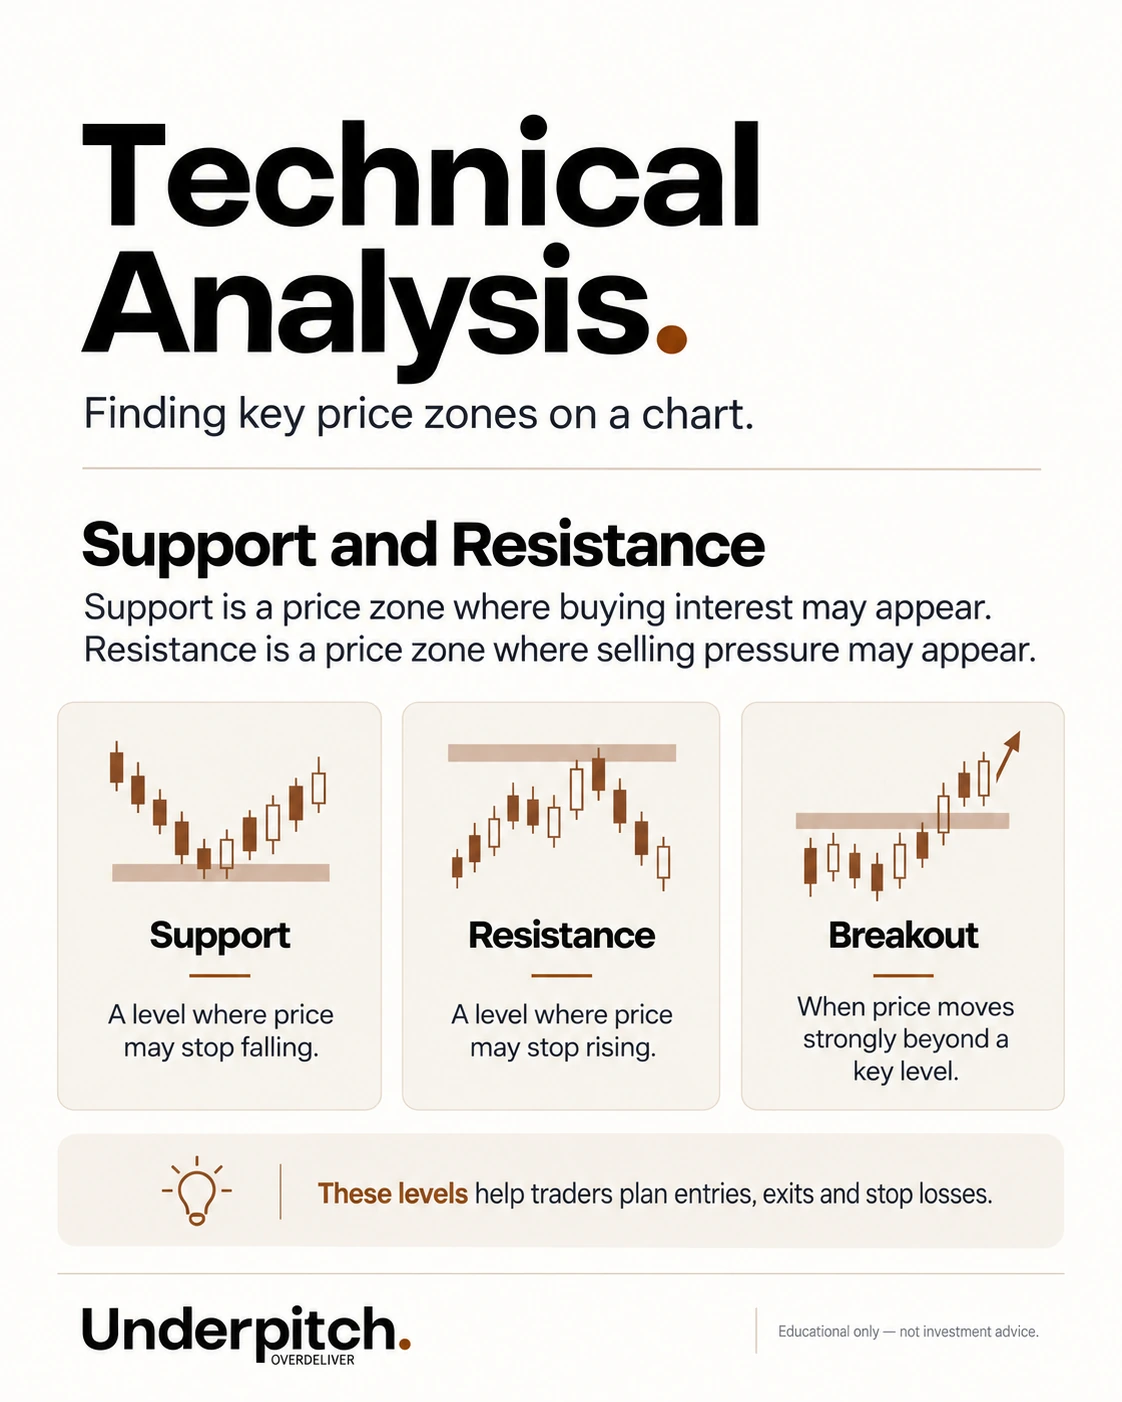
Chart patterns
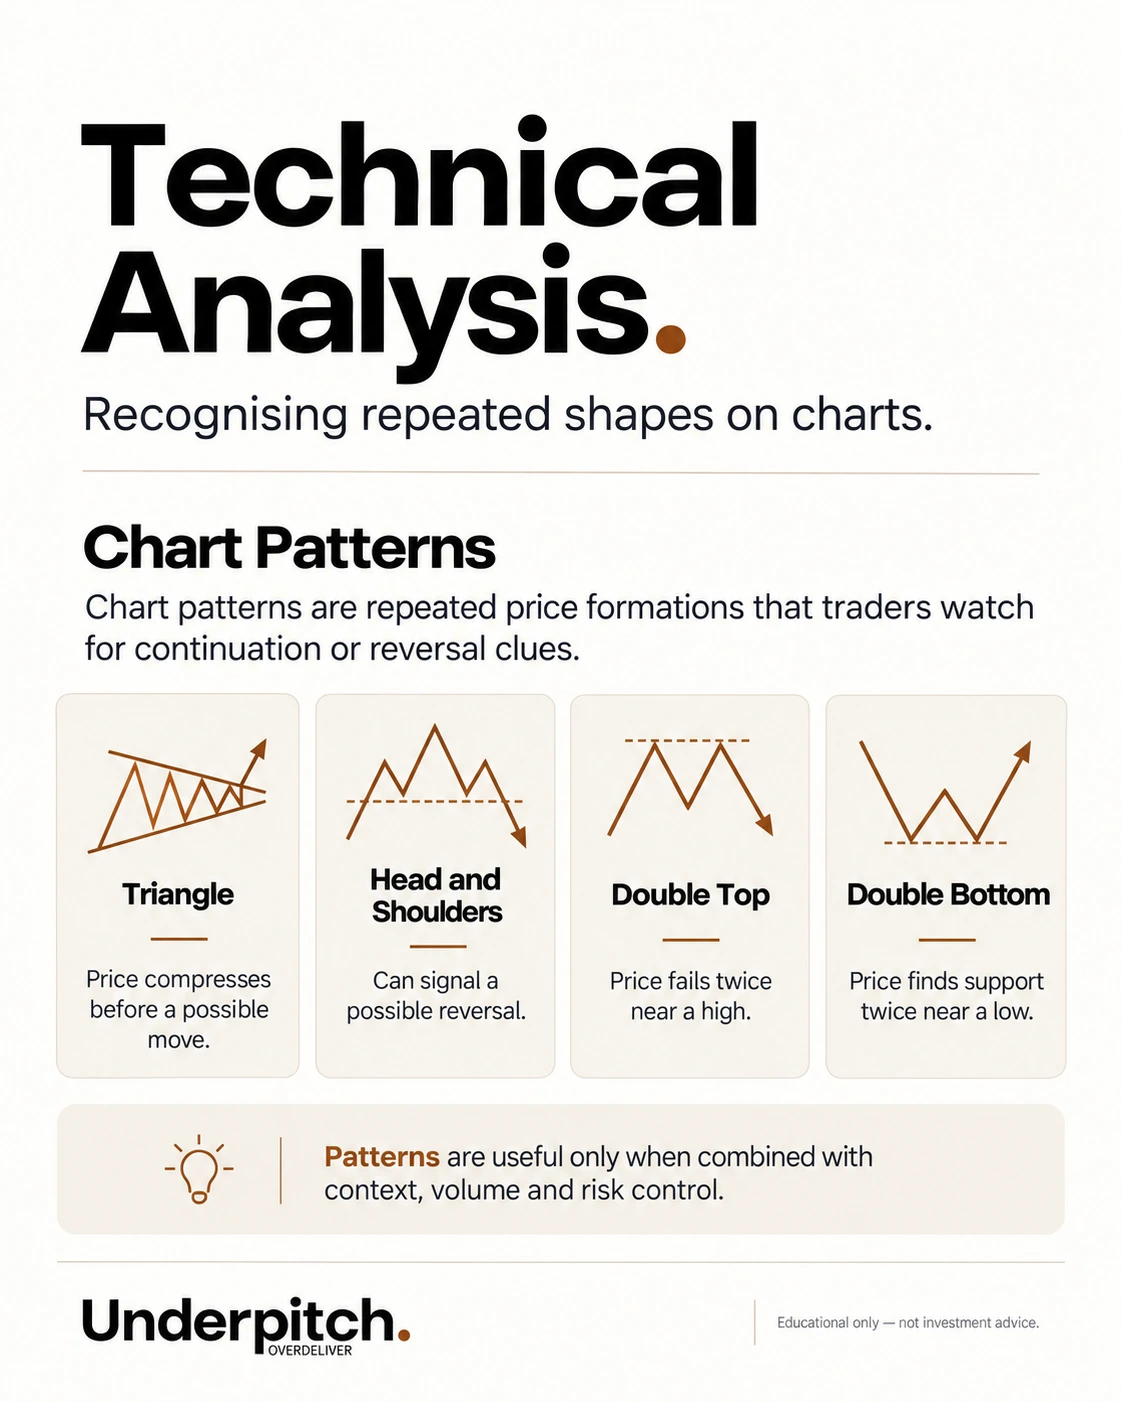
Chart patterns are repeated price structures traders use to organize market behaviour. Examples include triangles, head and shoulders, double tops/bottoms, flags and pennants. A pattern is not complete merely because a shape is visible; traders usually wait for a breakout, breakdown or other confirmation and define risk before entering.
Indicators
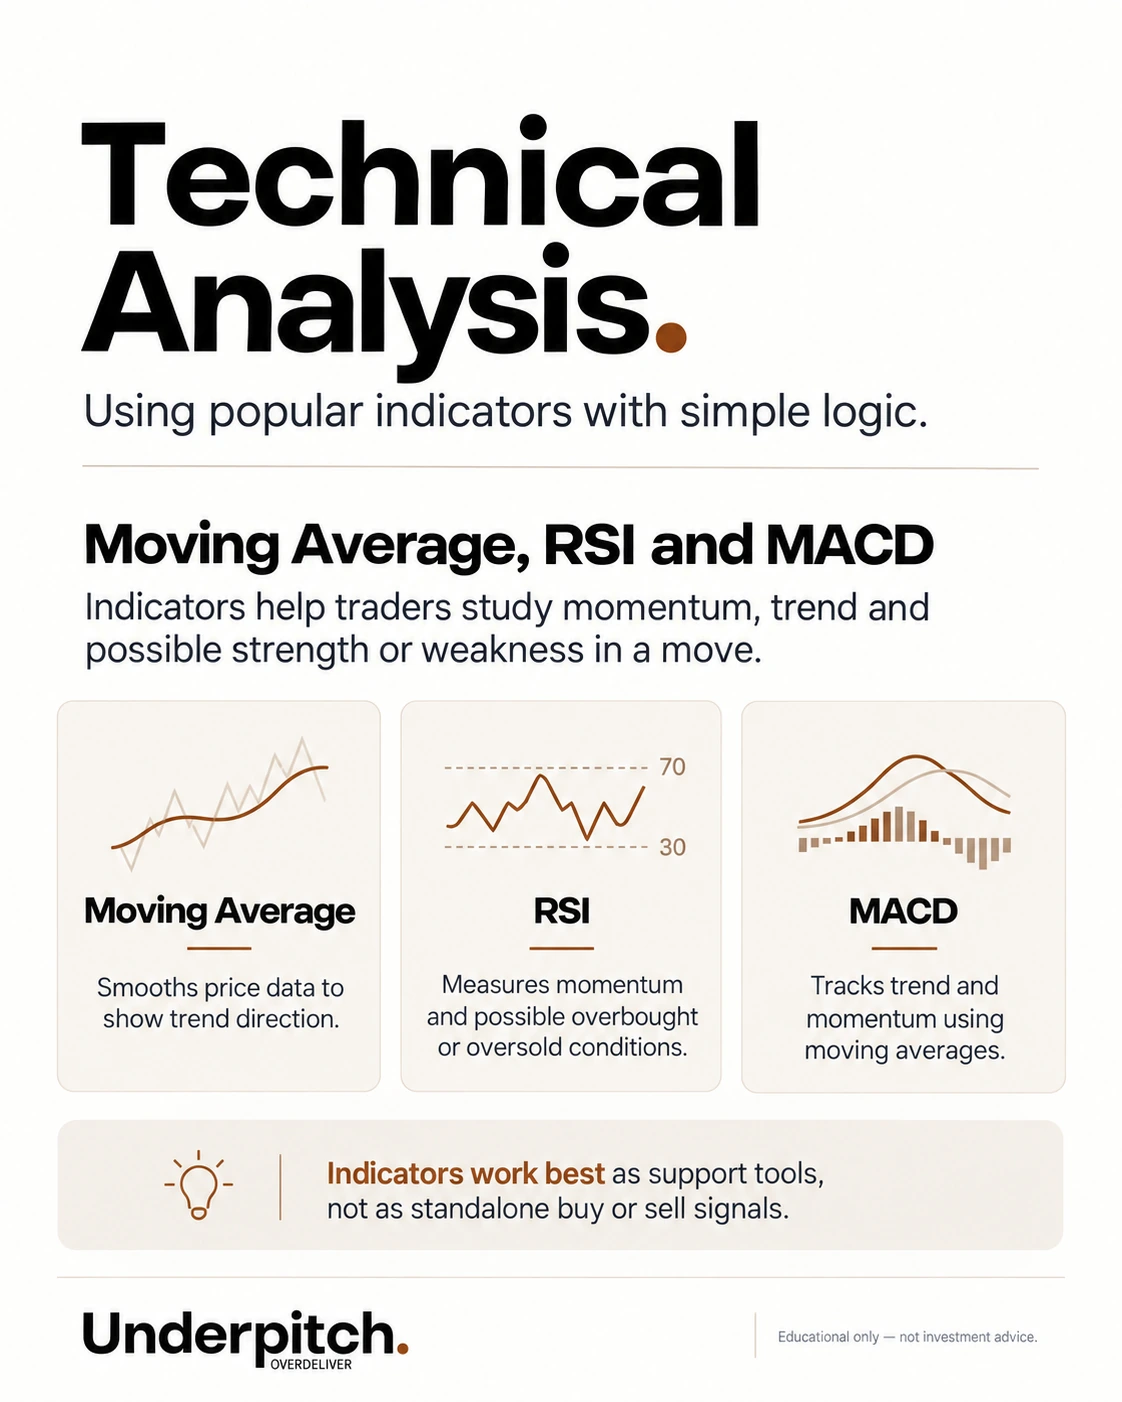
Indicators transform price or volume data into another view of trend, momentum or volatility. Moving averages smooth price, RSI measures momentum and MACD compares moving-average relationships. Indicators lag or simplify market data, so they should support a decision rather than replace price context and risk management.
Volume and momentum
Volume shows participation. Momentum describes the speed/strength of the move. Strong price movement with expanding participation often carries more information than the same move on weak volume, but no volume rule is infallible.
Risk management comes before the pattern
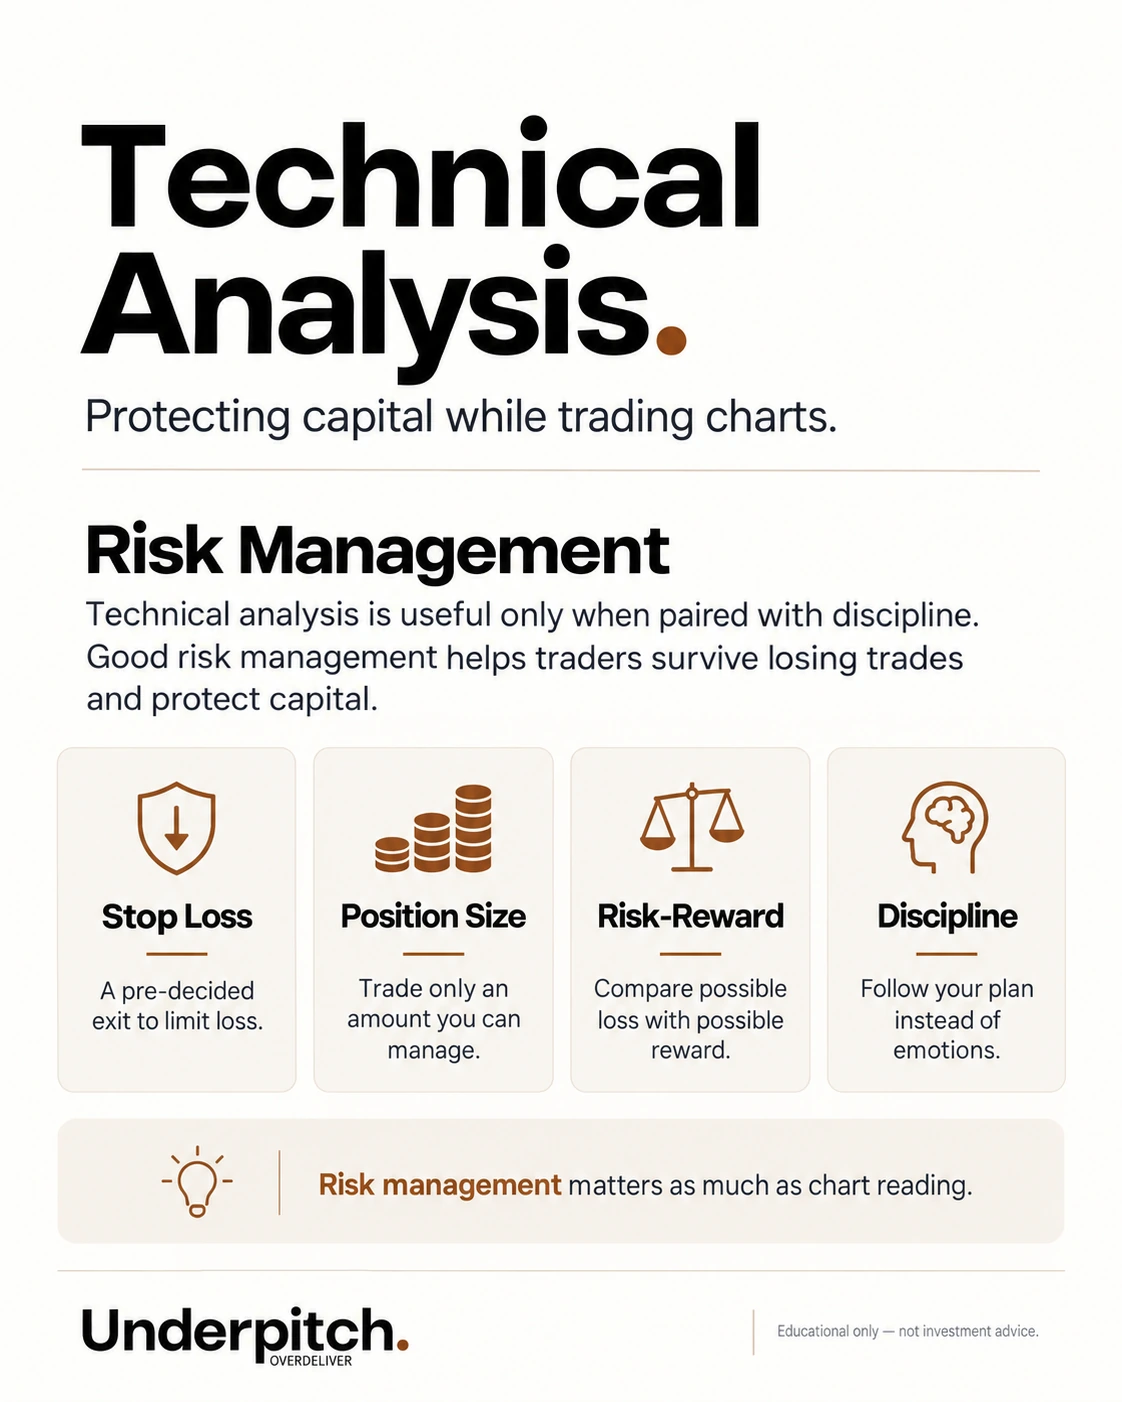
Define invalidation, stop-loss logic, position size and maximum loss before entering. A 60% win-rate strategy can still lose money if losses are much larger than wins. A lower win-rate strategy can work if average winners meaningfully exceed average losses.
Technical + fundamental
These are not enemies. Fundamental analysis can help answer what you want to own; technical analysis can help describe how price is behaving and where risk may be defined. Neither removes uncertainty.