Key market terms
Detailed plain-English explanations of market capitalization, P/E, EPS, dividend yield, beta, alpha, gamma, bonus shares, stock splits, liquidity and volume.
Key terms are tools, not verdicts
No single ratio or Greek tells you whether to buy or sell. Use each term for the question it was designed to answer, then combine it with business quality, valuation, liquidity and risk.
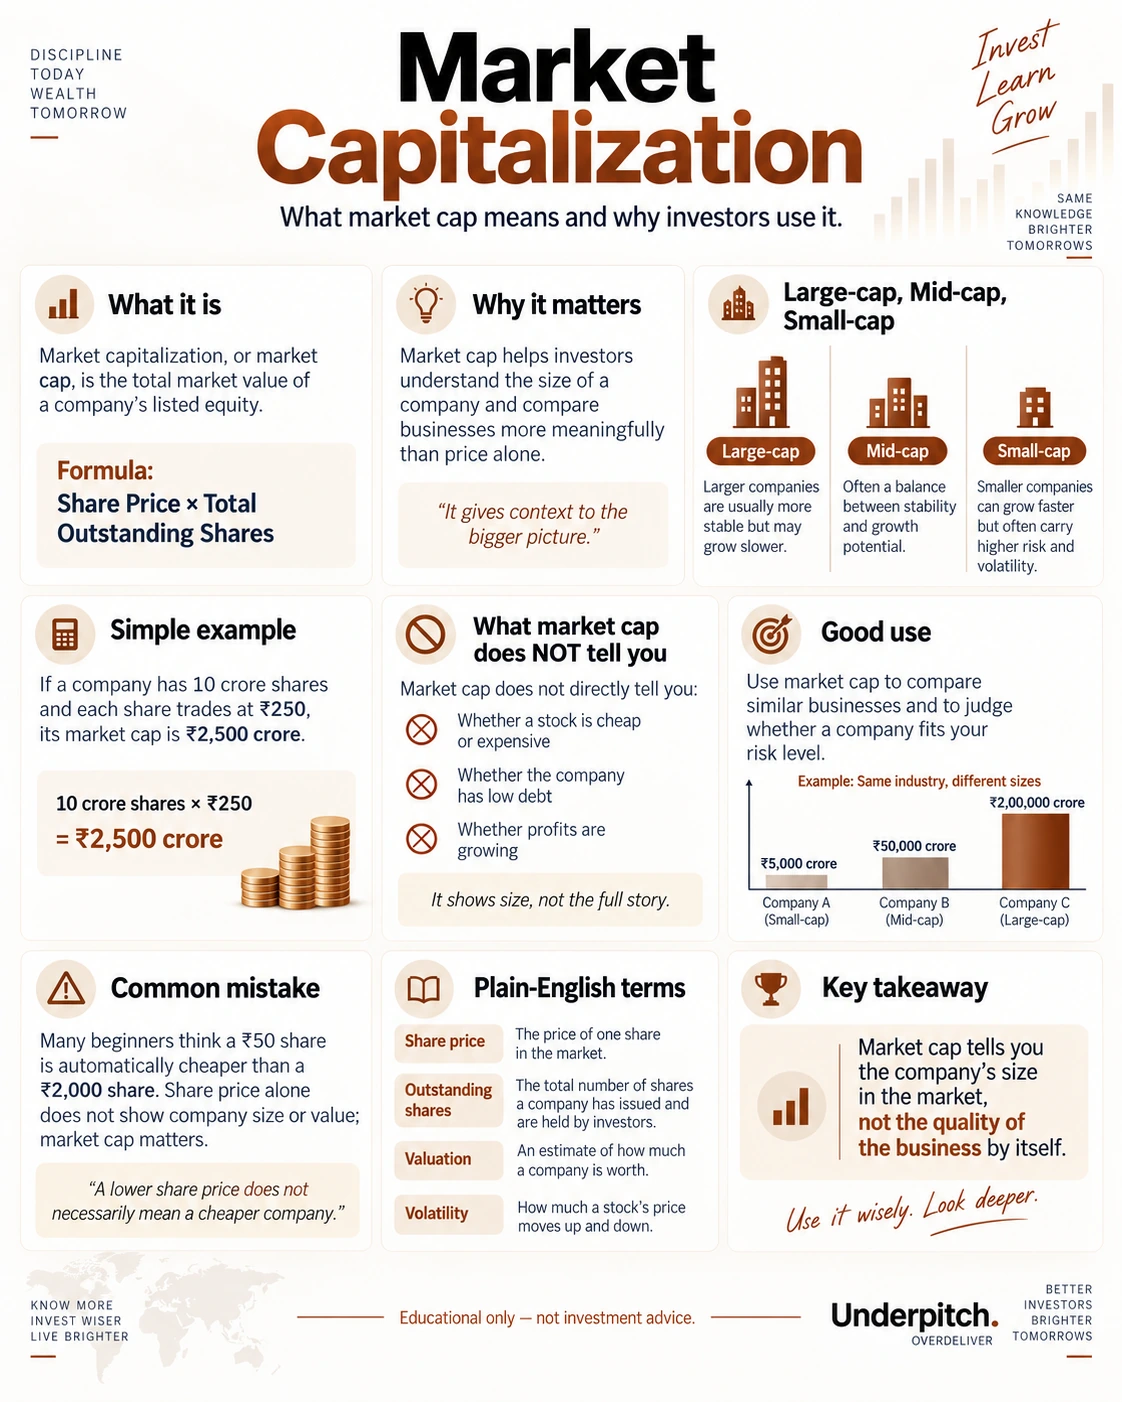
Market capitalization
Company size in the market. Formula: share price × total outstanding shares. It shows size, not business quality or cheapness. Example: 10 crore shares × ₹250 = ₹2,500 crore market cap.
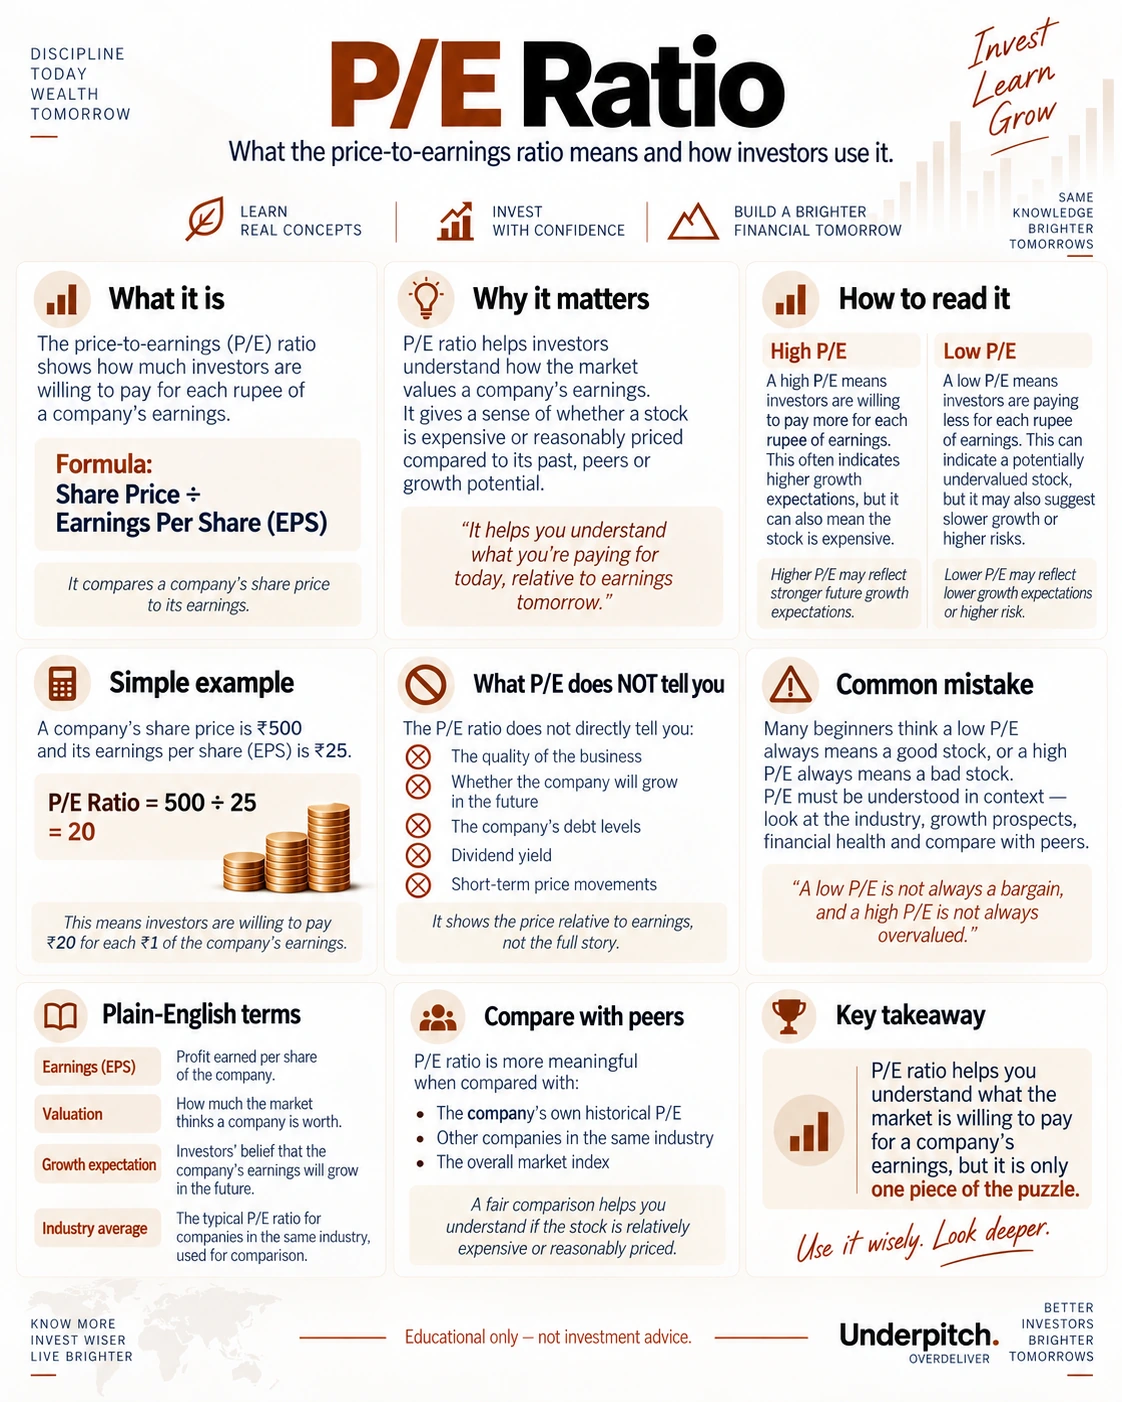
P/E ratio
Price-to-earnings. Formula: share price ÷ EPS. A ₹500 share with ₹25 EPS has a P/E of 20×. Compare with growth, quality, peers and history; low P/E does not automatically mean cheap.
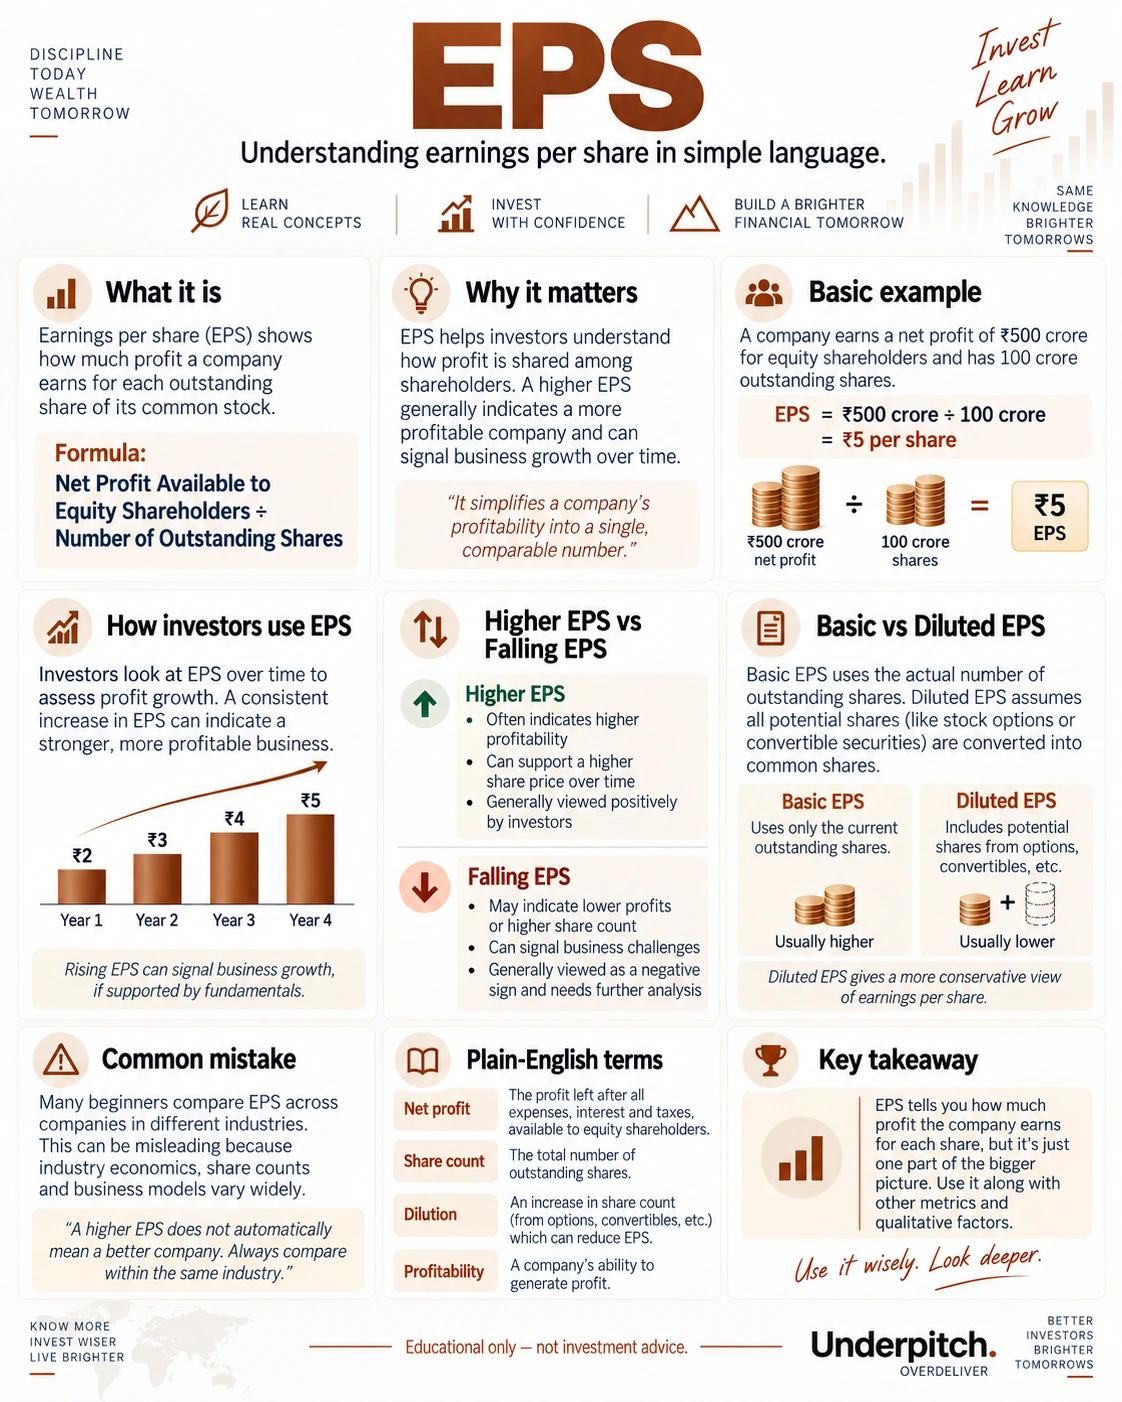
EPS
Earnings per share. Profit attributable to common shareholders divided by the weighted average share count. Rising EPS can reflect profit growth, but buybacks/dilution and one-off items matter.
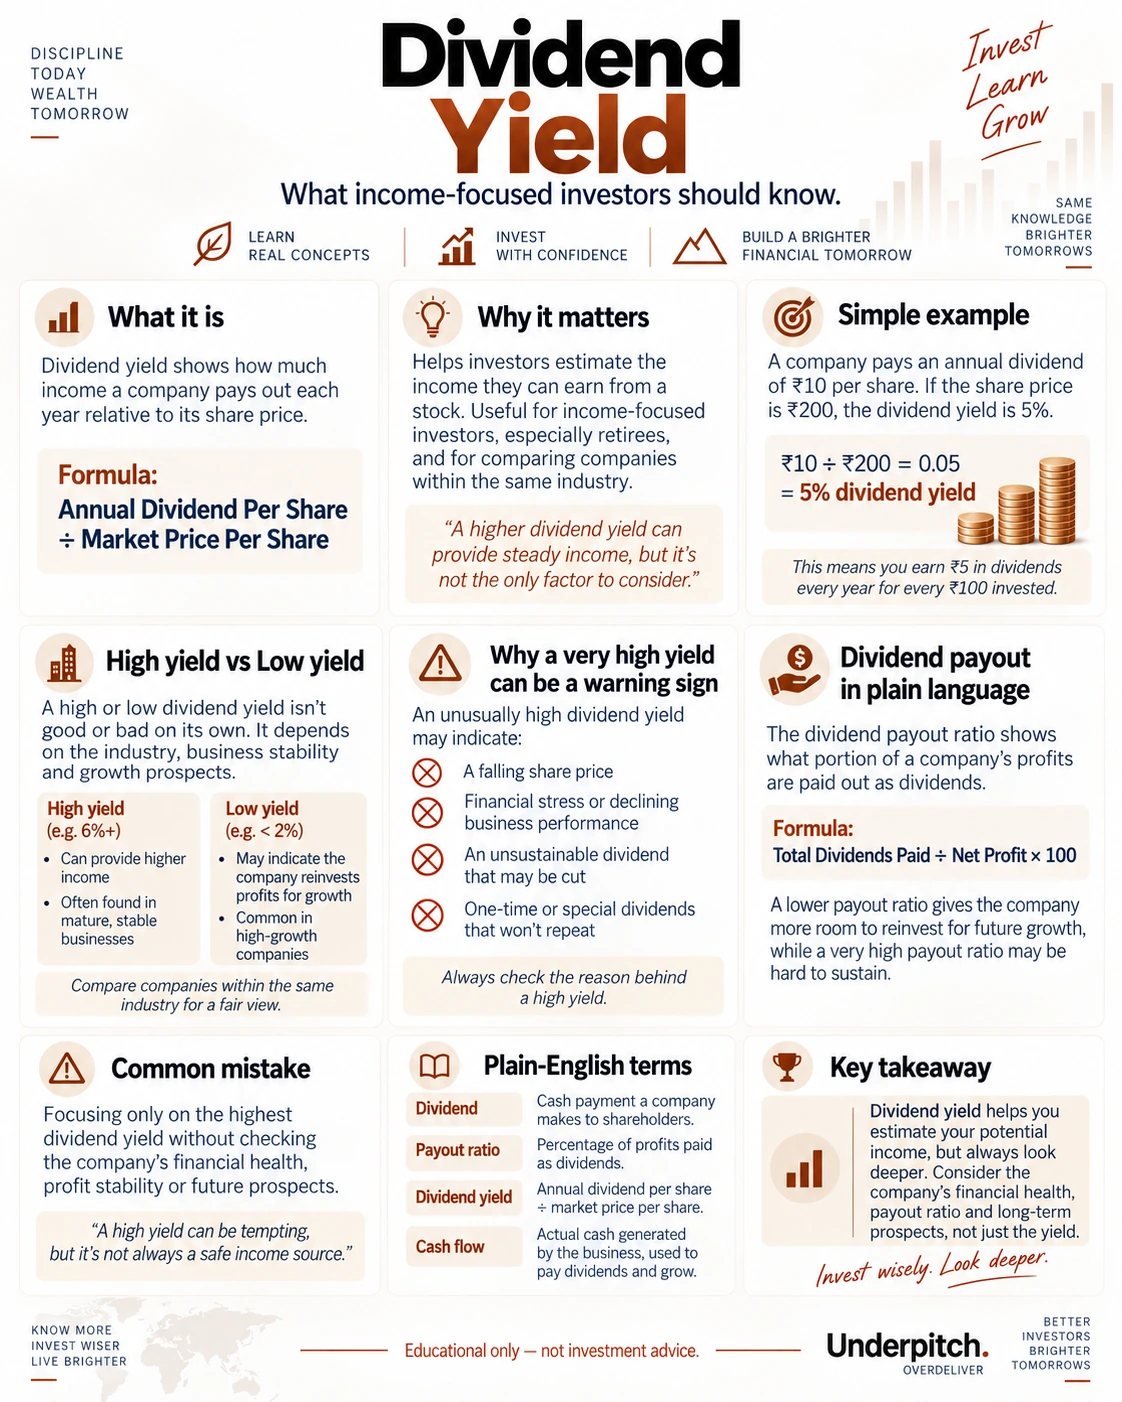
Dividend yield
Annual dividend per share ÷ market price per share. A ₹10 annual dividend on a ₹200 share is a 5% yield. High yield can be a warning if the share price fell because the business is weakening.
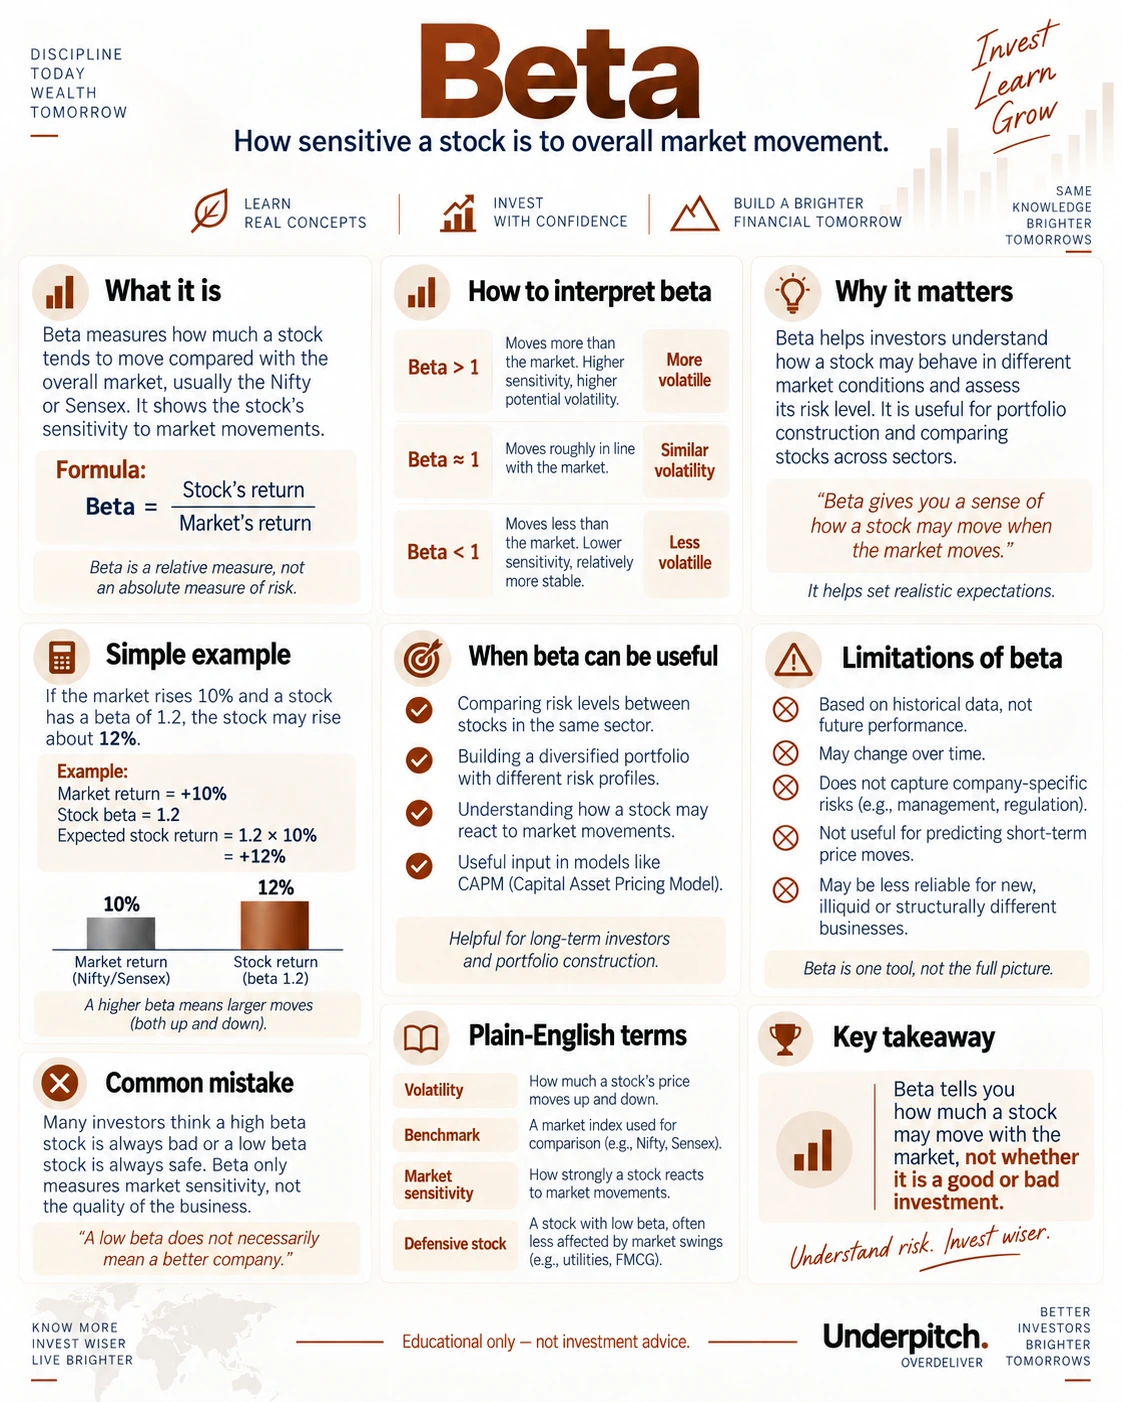
Beta
Measures sensitivity to market movement. Beta above 1 historically moved more than the benchmark; below 1 moved less. It is based on historical relationships and does not measure company quality.
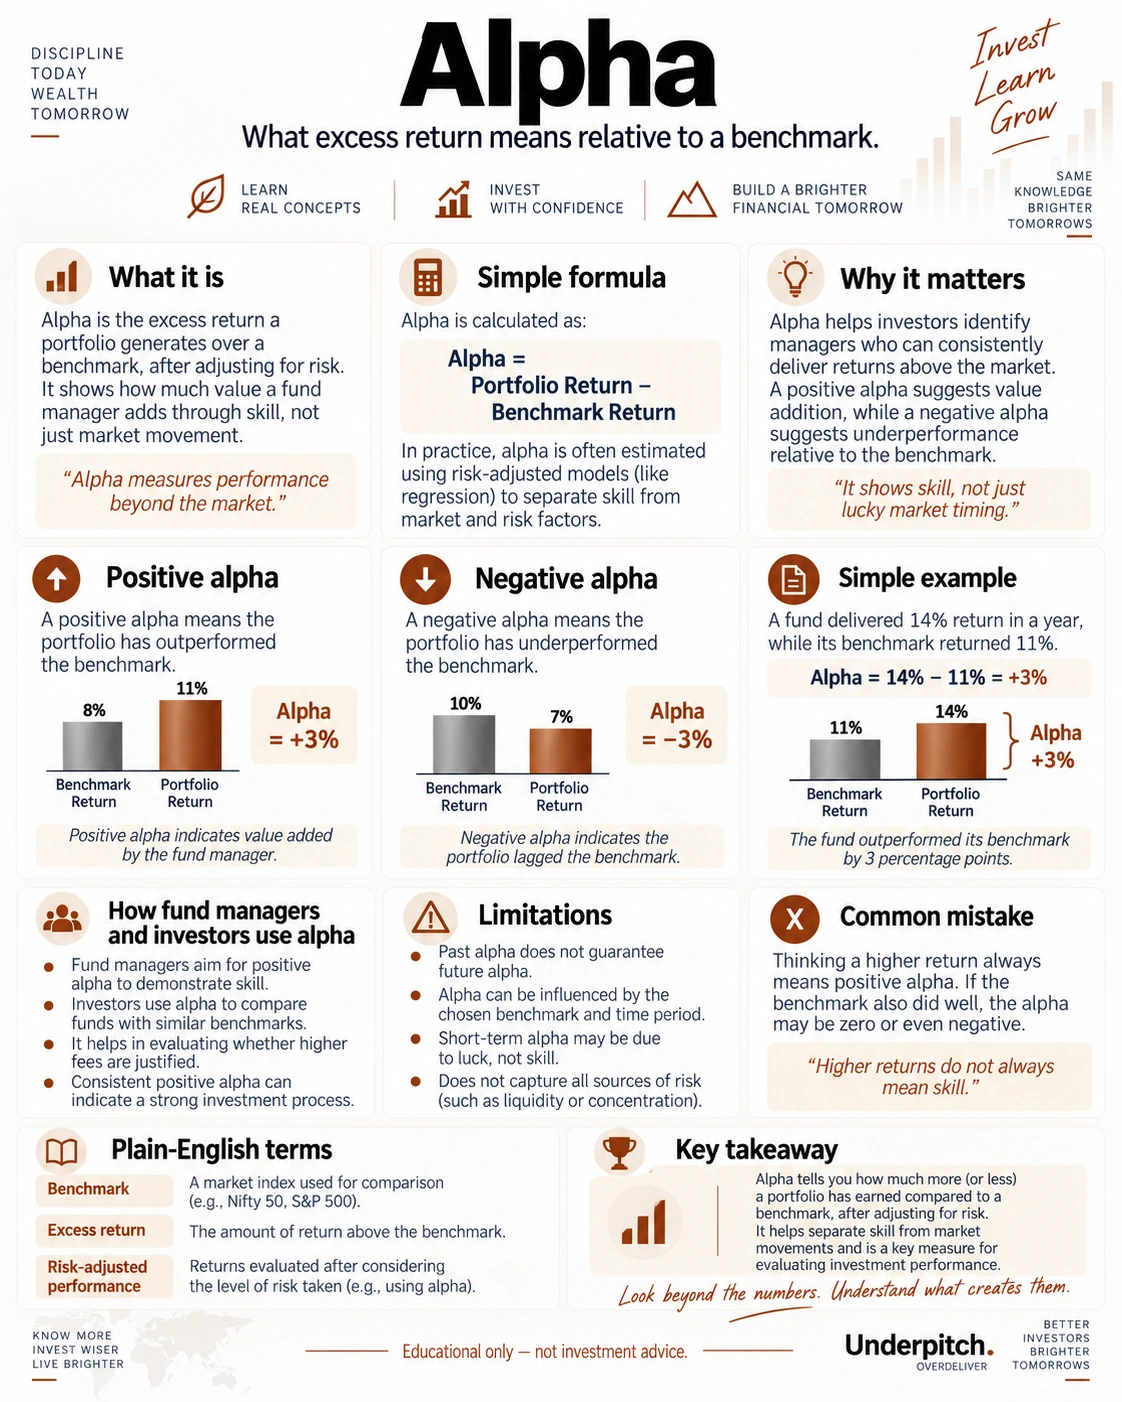
Alpha
Risk-adjusted excess return relative to a benchmark/model. Positive alpha suggests performance beyond what the benchmark/risk exposure would explain, but the estimate depends on model, period and benchmark.
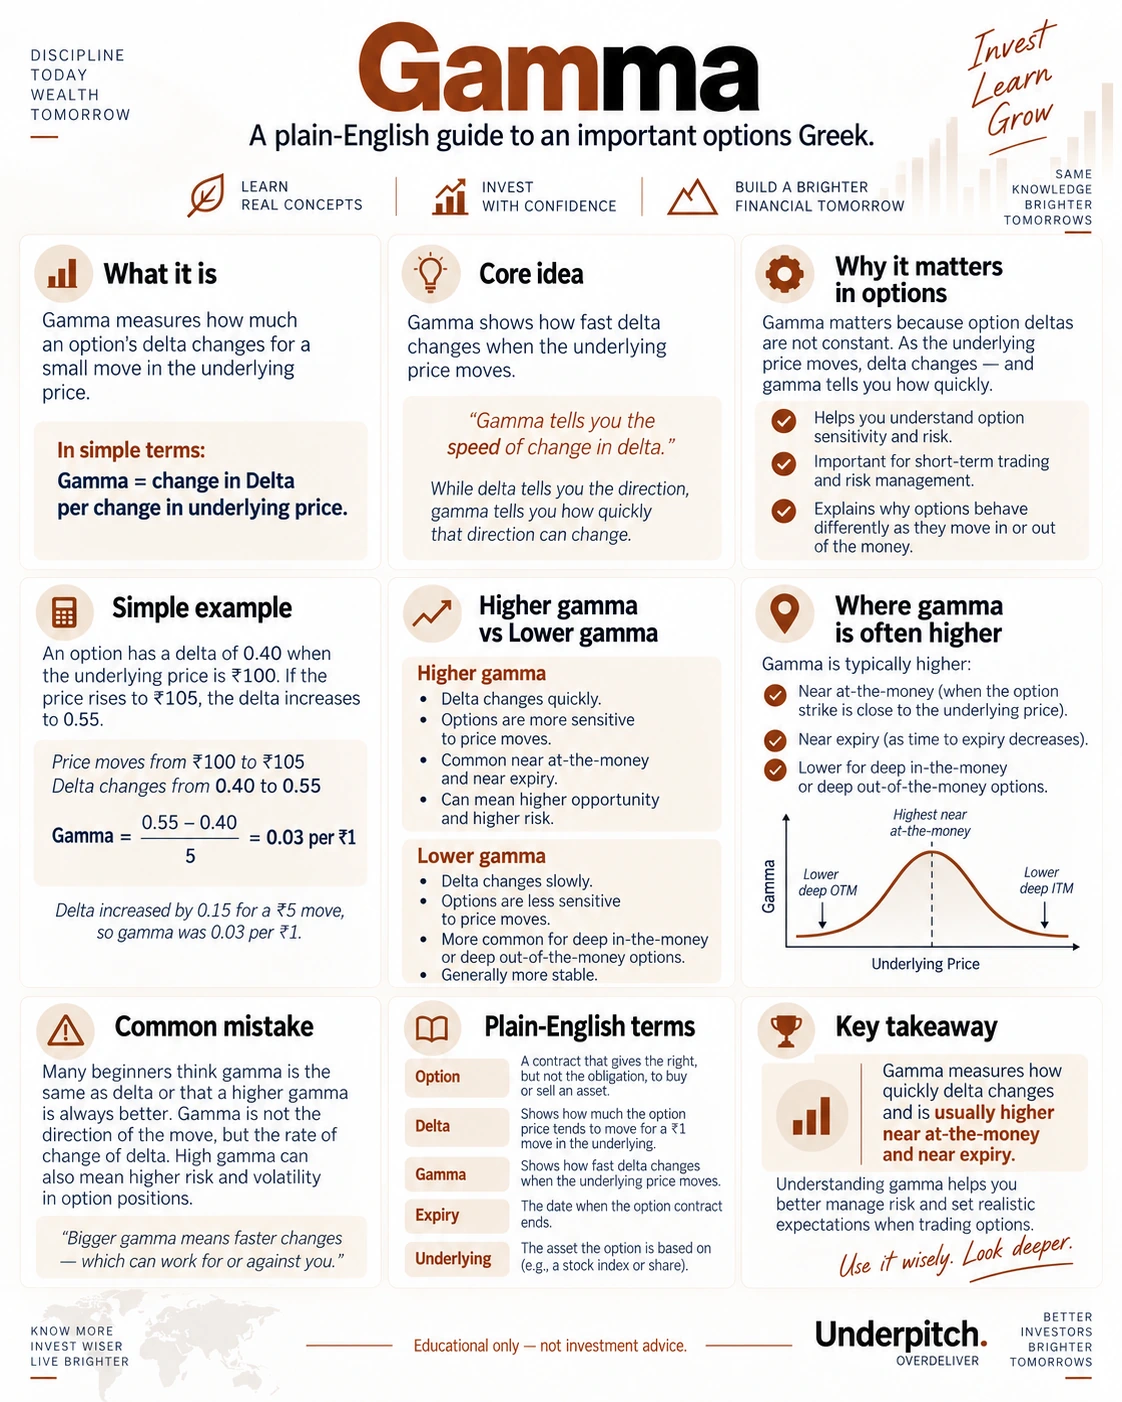
Gamma
An options Greek: how quickly an option’s delta changes when the underlying price changes. Gamma is often highest near-the-money and near expiry, making option sensitivity change rapidly.
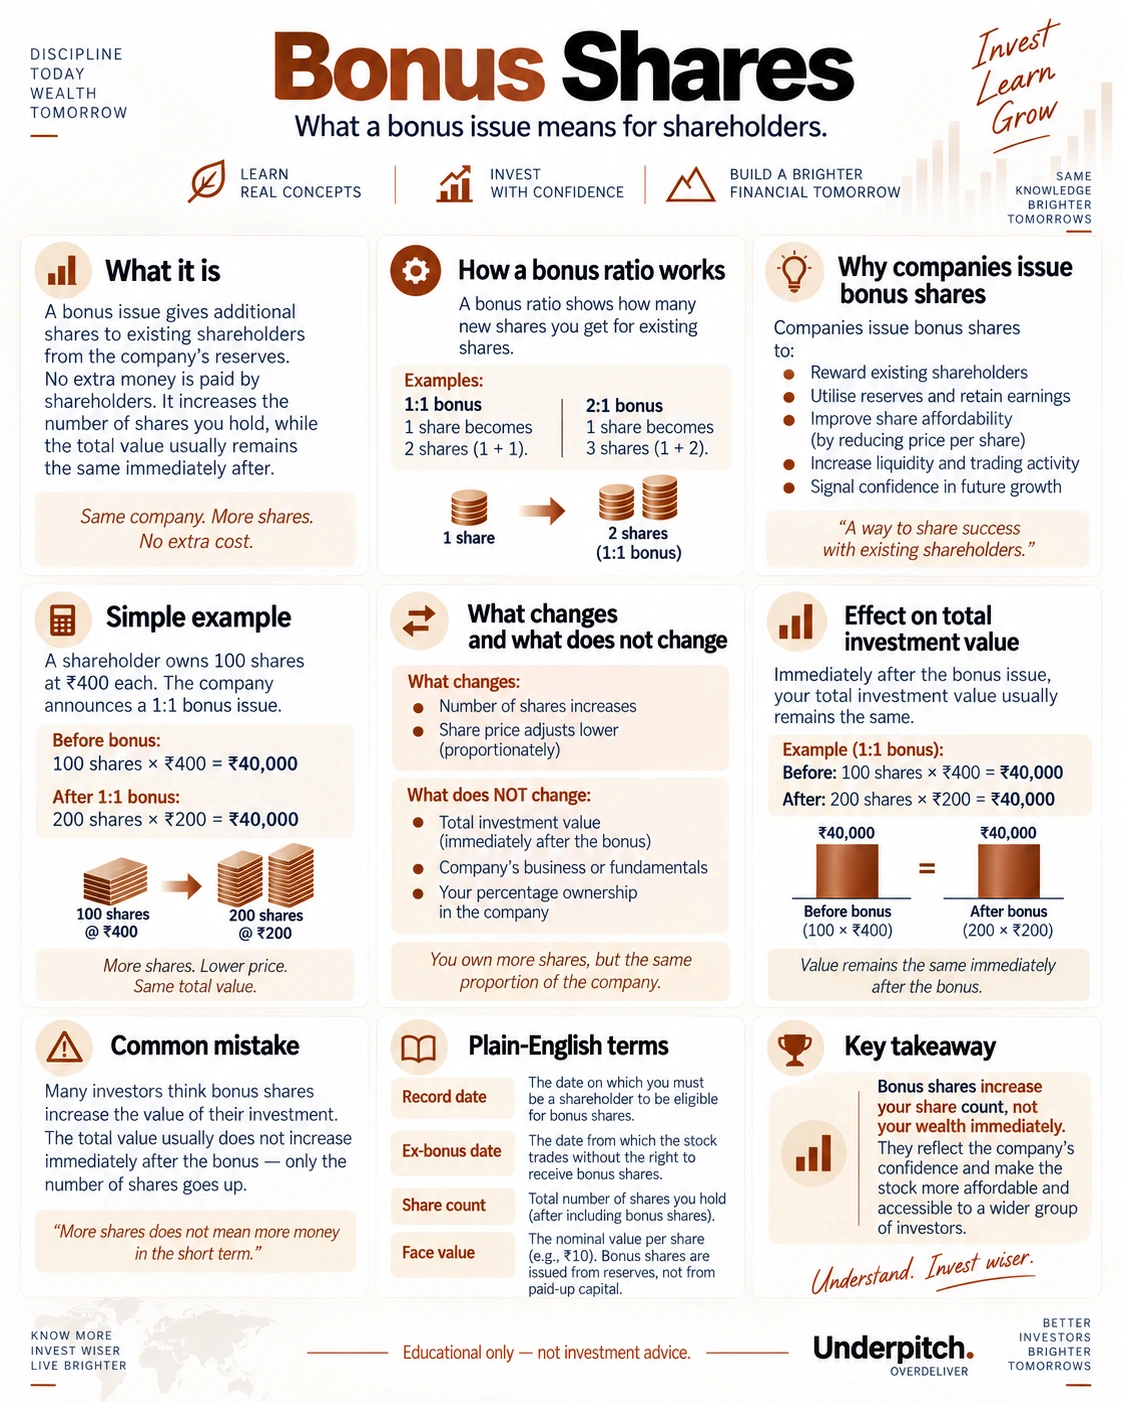
Bonus shares
Extra shares issued to existing holders from company reserves. Share count rises and price adjusts; immediate total wealth does not multiply simply because more shares appear.
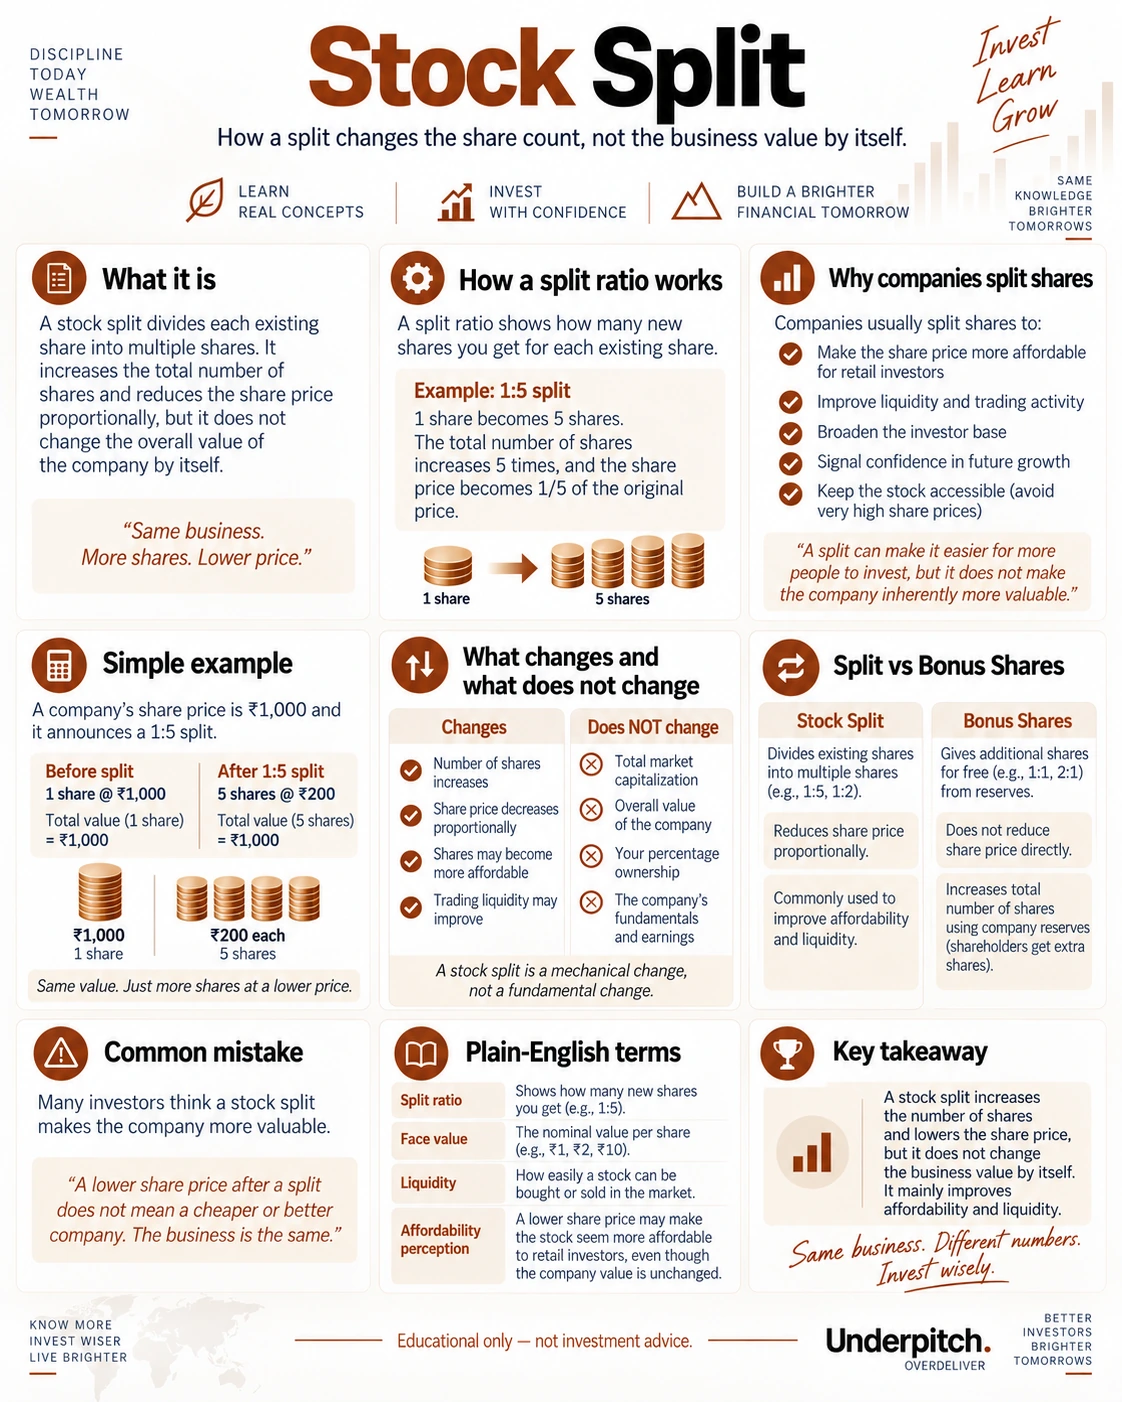
Stock split
Mechanically divides each share into more shares and reduces price/face value proportionately. Market cap and business economics do not change solely because of the split.
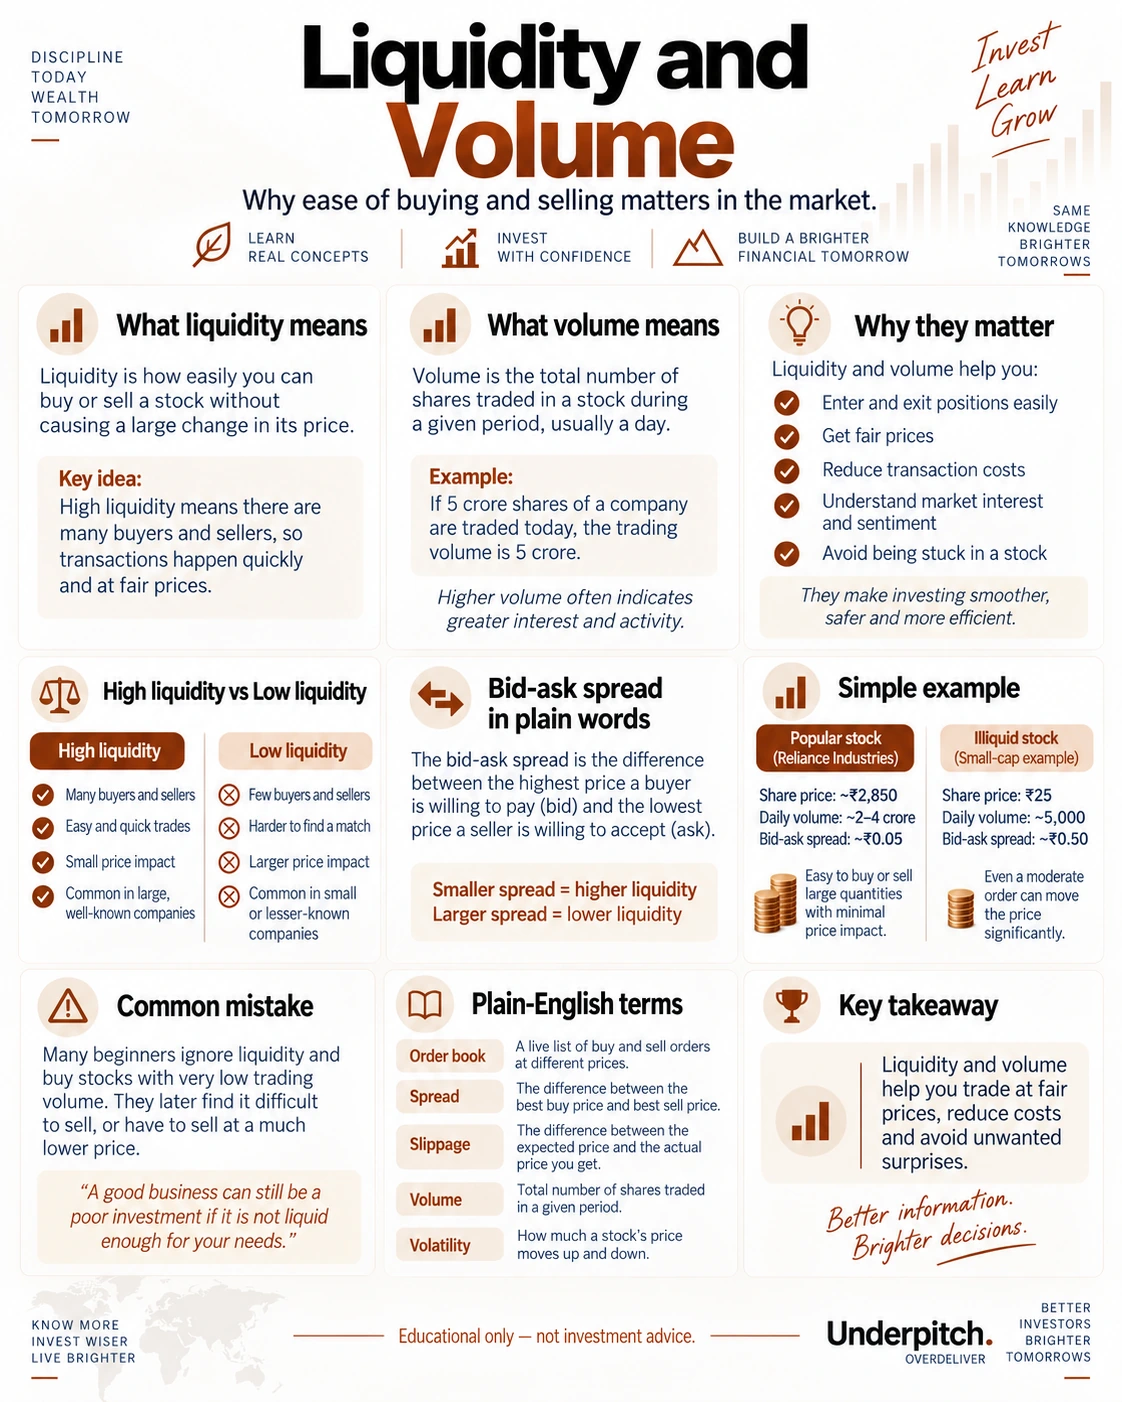
Liquidity & volume
Liquidity is ease of buying/selling near a fair price; volume is the number/value traded. A tight bid-ask spread and healthy depth usually indicate better liquidity; low-liquidity stocks can have high slippage.